Zero Trust Security
-
View ZTNA Dashboard
See moreThis article explains how to access data on the ZTNA Dashboard and enhance productivity and security by leveraging all available information in zero trust scenarios.
The Zero Trust Network Access (ZTNA) Dashboard provides a complete overview of all user and admin events within your network, all displayed on one page.
To filter the data displayed in widgets, start by using the User & Admin Events filter and the time filter located in the upper-right corner of the ZTNA Dashboard.
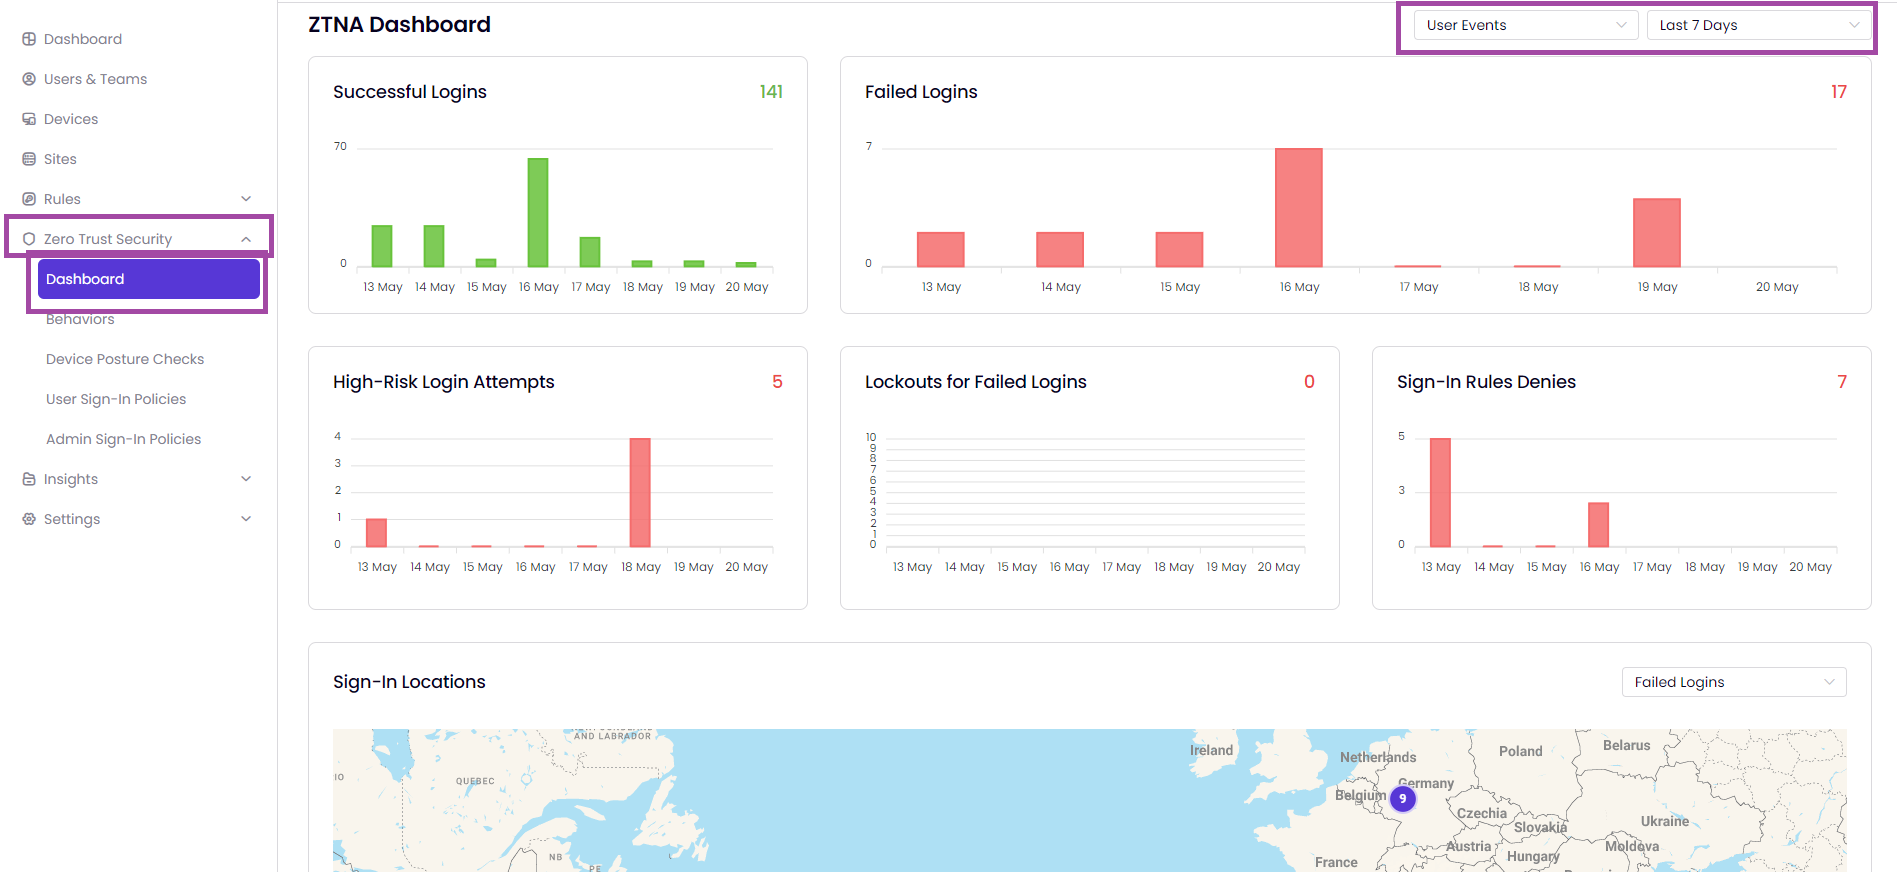
Access the information on successful logins, failed logins, high-risk login attempts, lockouts for failed logins, sign-in rule denies, and sign-in locations on graph and a map.
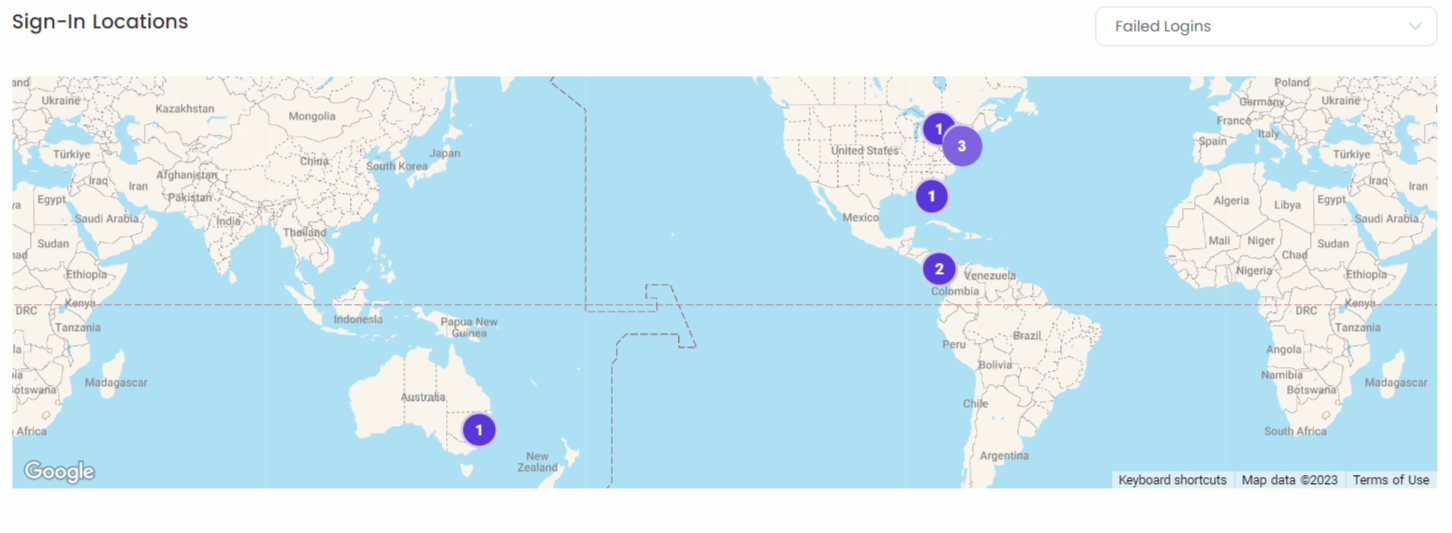
- You can also access the locations of all events using the map in the Sign-In Locations widget.
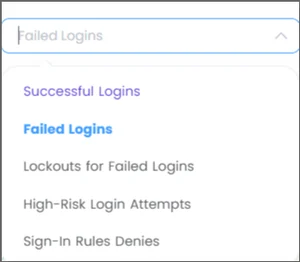
- To zoom in on the map, use ctrl+ scroll. In addition, you can view the event types included in the widget by using the map filter in the upper-right corner.
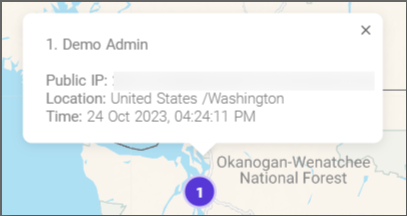
- Double-click the purple number icons on the map to access login information such as the username, public IP, location, and time.
- For a better view, use the Keyboard Shortcuts dialog located in the lower-right corner of the map.
- By clicking on the widgets, you will be directed to the Events page where you can see all the User Events and Administrator Events, including their respective details with the IP Intelligence information about their device. Click the View Events page to see more.
-
User Sign-In Policy
See moreThis article will guide administrators on how to create behavior-based, user sign-in policies Timus ZTNA.
Timus ZTNA offers a unique and improved access control method that allows businesses to expand without compromising the fundamental security of their network, which includes infrastructure, applications, data, users, and devices.
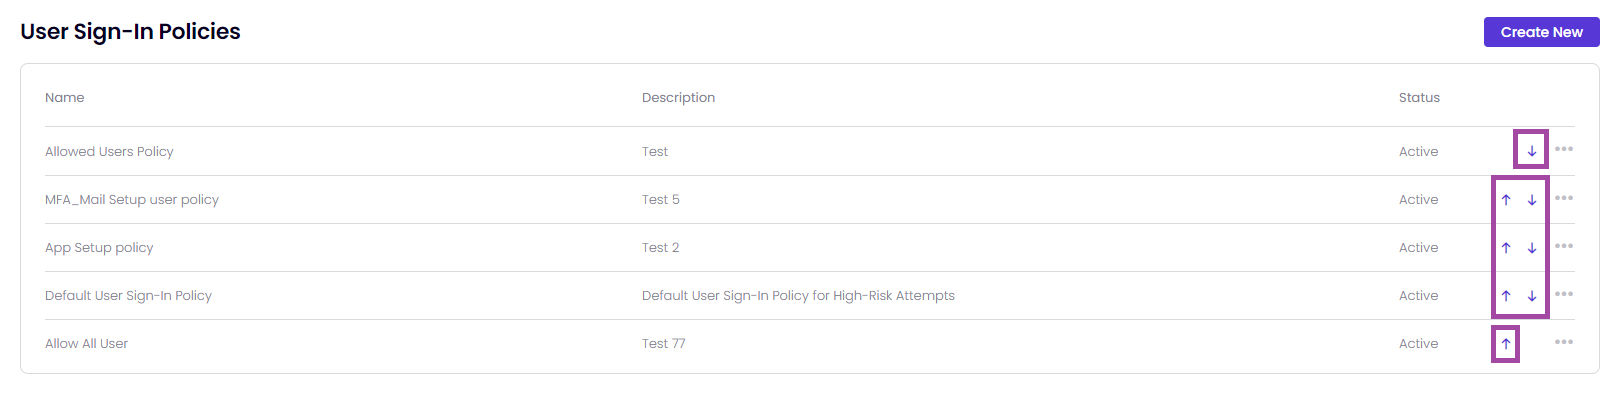
- In the "User Sign-in Policies" page, you can see the following information from left to right: Name, Description, and Status of both default and custom policies.
- You can use the search filter in the upper left corner to find and adjust policies quickly.
The policies within Timus' Zero Trust Network Access (ZTNA) security framework are organized and prioritized by its place in the policy table. A policy, which is placed higher in the table, is more prioritized than the other User Sign-In policies.
 It means that you are able to prioritize the Timus ZTNA rules by yourself.
- To create a custom policy for a user, click the "Create User Sign-in Policy" button on the right side of the page.
- The total number of policies defined in your network will be displayed just below.
- To manage a policy, click the ellipsis icon located at the end of its general details.
- From here, you can edit the policy or create a new one using the Copy feature.
- Additionally, you have the option to Activate/Deactivate or Delete the policy.
You can Deactivate the default user sign-in policy.
To create a new User Sign-In/Login Policy, follow these steps:
- Go to the Timus Manager -> Zero Trust Security -> User Sign-In Policies page.
- Click the "Create User Sign-In Policy" button on the right side of the page.
A pop-up window will appear with the following tabs:
- Source,
- Condition,
- Action,
- Alerts & Notifications.
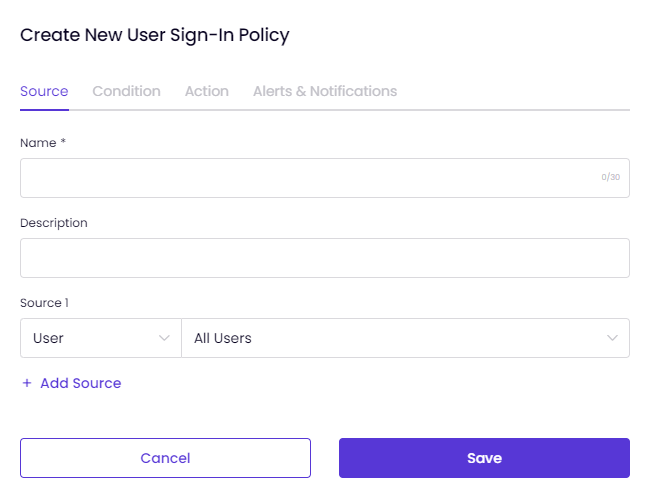
On the Source tab:
- Enter a Name and Description for the policy you are creating. For example, "Default User Sign-In Policy" or "Default User Sign-In Policy for High-Risk Attempts."
- Click "Select" and choose the Source as User/Team/Tag or Public IP.
- Enter a Description based on the Source type you selected.
If necessary, you can select multiple sources to apply to the policy.
On the Condition tab,
- Choose the Authentication method that you prefer to verify the source of your policy, whether it's Any, Connect App, or User Portal.
- Set the risk level to Any, High, Medium, or Low.
- Select the Behavior on which this policy will be applied.
- Click on + Add Behavior. You can select multiple behaviors to trigger the policy.
Schedule the policy.
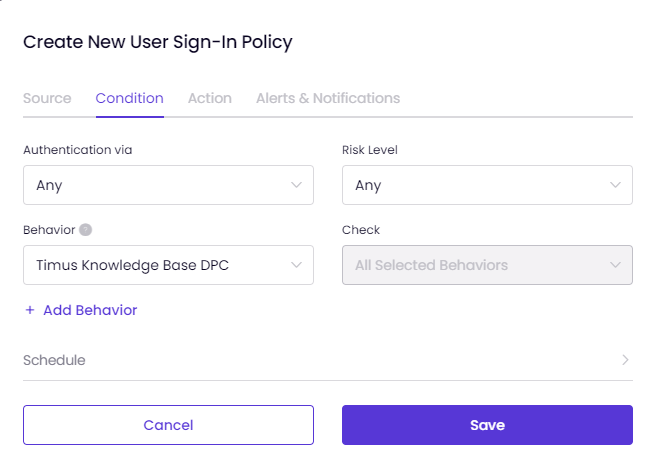
When "All Selected Behaviors" is chosen, all selected behaviors such as Untrusted IPs, New Device, and Breached E-mail Address must be active simultaneously for the policy to take action.
When "Any Selected Behavior" is chosen, at least one of the selected behaviors must be triggered by the policy to take the action.
You can consider All Selected Behaviors like "AND &&" and Any Selected Behaviors like "OR ||" as in coding language.
Experience the user-friendly interface of Timus by hovering over the info icons on the policy creation screen:
When you add a behavior to the policy with the add behavior button on the screen and hover over that behavior, you can view the brief explanation about the behavior you added:
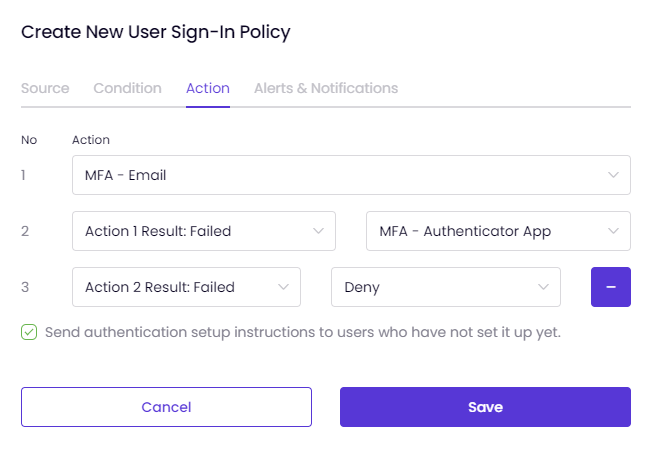
On the "Action" tab,
- You can determine how the system should respond when a certain behavior triggers a policy.
- The system offers various actions, including Allow, Deny, Ban, MFA-Email, MFA Authenticator App, Deny and Block IP, and Ban and Block IP.
- You can select multiple actions for multi-factor authentication which are numbered on the left side of the tab: If you select MFA-Authenticator App and MFA-Email actions, you will have the option to add more actions for login attempts.
- This means that if the first authentication step fails, you can enable another action and send two-factor authentication setup introductions to users.
Select an action from the drop-down list.
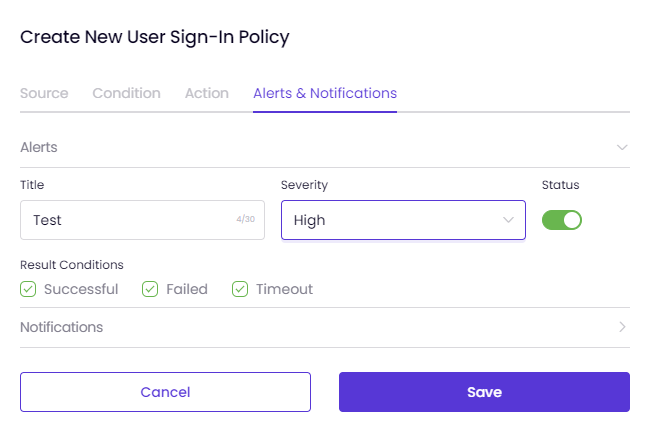
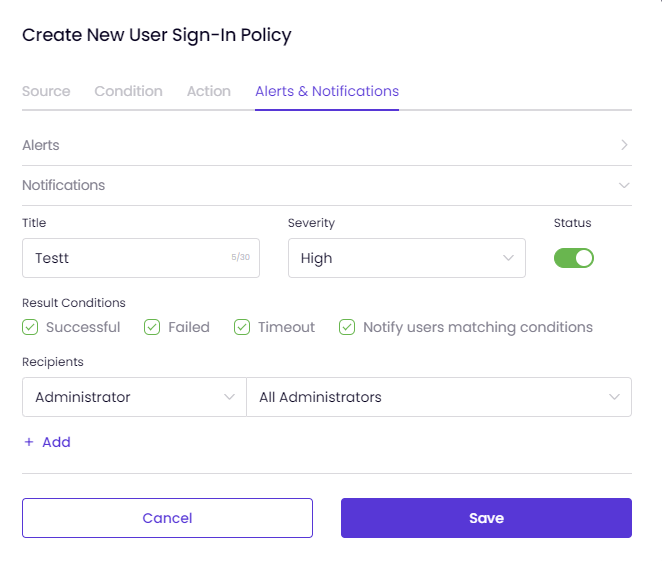
 To set Alerts and Notifications for your policy,
- Go to the tab on the policy screen,
- Enter a title for the alert and select the severity (High, Medium, or Low).
- To activate the alert, make sure the Status is switched to ON.
- Specify which Result Conditions will trigger the alert, such as Successful, Failed, or Timeout.
- To create a notification, click on "Notifications" and enter a Title.
- Select the severity (High, Medium, or Low) and turn the Status ON to enable the notification.
- Specify the Result Conditions that will trigger the notification (Successful, Failed, or Timeout).
- If necessary, you can check the box labeled "Notify Users Matching Conditions" to notify policy-bound users.
- Additionally, you can specify recipients for the notification by choosing between administrators or external users. It is possible to assign multiple recipients to the policy.
- If you select administrators, all admins in the system will be listed, and you can choose "All Administrators."
- If you select External user, enter their Name and Email Address.
- To delete a recipient, simply click x at the end of the line.
- Once all the required information is entered, click "Confirm" to create your user sign-in policy with Timus ZTNA.
- To edit the default policy on the page, click on the ellipsis icon located on the policy row and select "Edit" from the mini drop-down list.
- Once you have made the necessary changes to the policy configuration and click Confirm, you can reapply it to Timus ZTNA with your updated settings.
- You also have the option to create a similar policy with minor adjustments using the Copy feature in the list.
-
Create Behavior
See moreTo add customized behaviors to your network, visit Timus Manager, then select Zero Trust Security> Behaviors. This allows you to expand on the default behaviors provided by ZTNA for more comprehensive risk assessments in network use cases.
To find your network's pre-configured behaviors, go to the Name and Details parameters page. These behavior settings are already set up for your network and can be viewed and adjusted if necessary.
The general information of the default behaviors displayed on the page are as follows:
- New Device - Default Compare with the last 10 authentications.
- Out of Radius - Default When the Radius from the location is 50 miles. Last 3 locations
- New Country - Default Compare with the last 5 authentications.
- Impossible Travel - Default When the assumed maximum speed is 1000 mph.
- Last Sign-In Date - Default Last sign-on date older than 30 days.
- Untrusted IP - Default
- Breached E-mail Address - Default Include Breaches and Disclosures that occurred within the last 180 days.
- Consecutive Failures at Same Account - Default When consecutive failures are 5 times.
- Consecutive Failures at Any Account - Default When consecutive failures are 5 times.
- You can get more information about a behavior by clicking on the ">" symbol next to its name.
- To customize the default behavior, click on the ellipsis icon (three dots) next to the "Details" option.
- This will open the Edit feature where you can make changes according to your preferences.
- Moreover, you can create a new behavior by copying the default behavior with just one click on the Copy Feature.
- This way, you can modify the copied behavior without affecting the original.
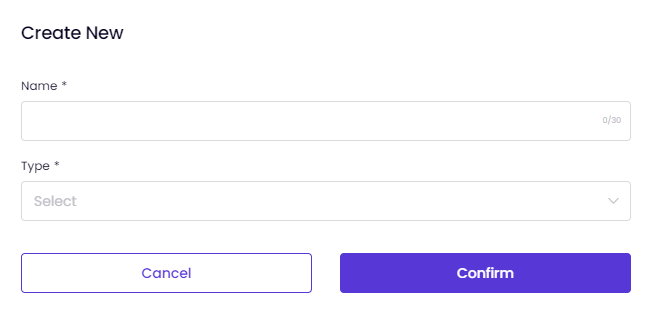
To create custom behaviors for your network policies, do the following:
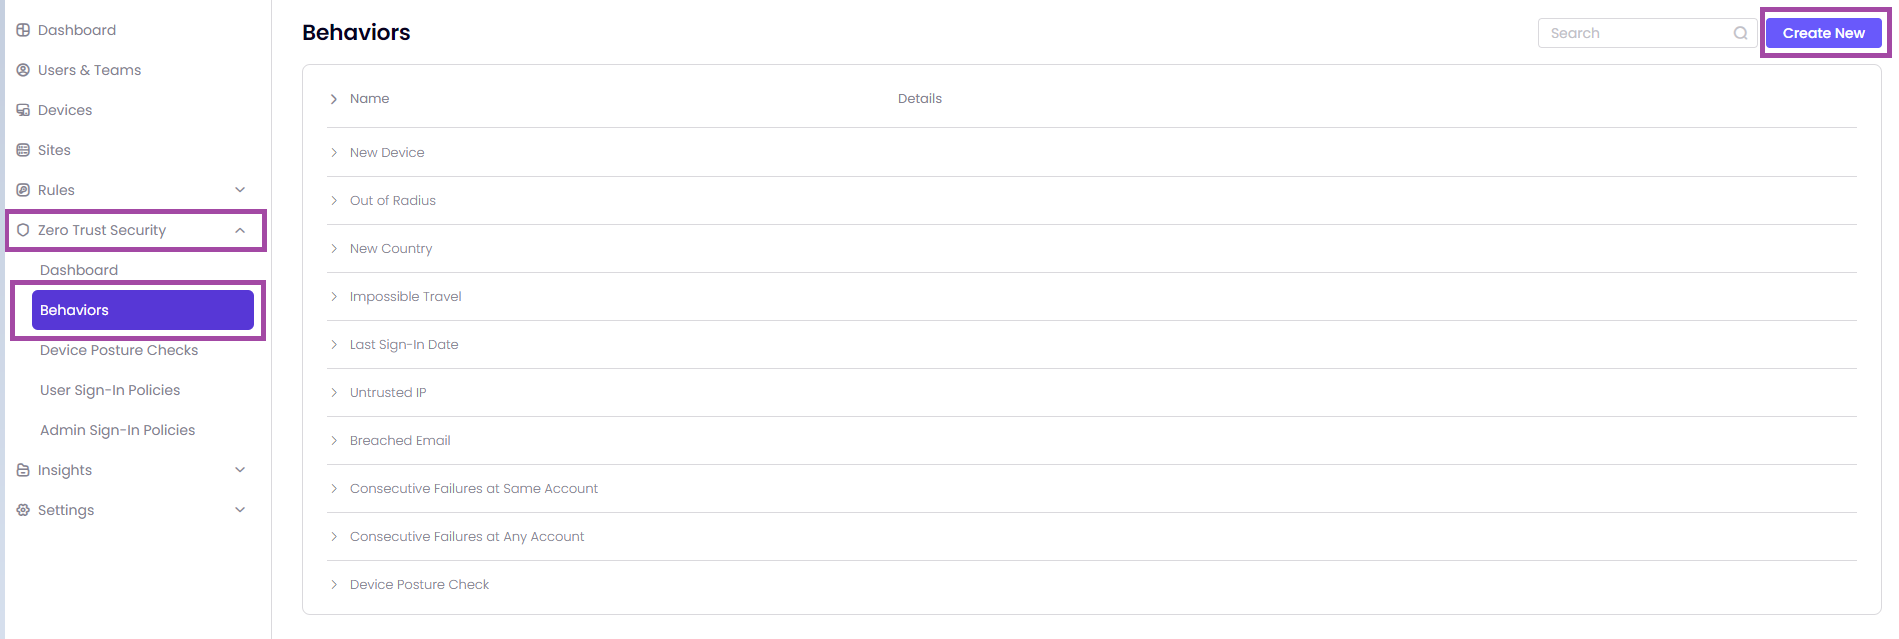
- On the right side of the page, find the Create Behavior button.
- Click on the Create Behavior button to start creating a new behavior.
- Follow the prompts and provide the necessary information to define the behavior.
- Enter a Name select a Behavior Type - the behavior classification of Timus for the ZTNA trigger.
- Click Confirm.
This behavior is triggered when users attempt to sign in to the system from a different device than the previous devices they successfully signed in with.New Geo-LocationThis behavior is triggered when users attempt to log into the system from a different location than their previous successful signed-in locations.New CountryThis behavior is triggered when users attempt to sign in to the system from a new country than the previous countries they successfully signed in from.Impossible TravelThis behavior is triggered if there is an unusual time and distance between the user's last sign attempts.Last Sign-On DateThis behavior is triggered if more than the specified time has passed since the user's last successful login.Untrusted IPThis behavior is triggered when the user tries to sign in with an untrusted IP address.An IP address is tagged as “untrusted” if it has recently been involved in abusive activities, or is part of the TOR network, or is part of a proxy network.Certain public IP addresses can be used for malicious purposes, causing them to be tagged as Untrusted IPs by Timus ZTNA framework. Those IP addresses may then be given to legitimate users by the IPs. If you use Untrusted IP behavior to deny user or admin sign-ins, their sign-ins will be denied until their IP addresses become trusted again, or they start using other trusted IP addresses.Breached E-mail Address - DefaultThis behavior is triggered if there have been any breaches or disclosures within the selected days.Consecutive Failures for the Same AccountThis behavior is triggered if more than a specified number of failed login attempts have been tried to the same user's account.Consecutive Failures at Any AccountThis behavior is triggered if more than a specified number of failed login attempts have been tried on any user's account.Device Posture Check This behavior depends on what EPP you have been using, the trigger can be Passes or Fails. -
Manage Zero Trust Policies
See moreTimus Zero Trust Policies provides a user/ behavior-based access control as an alternative to traditional IP-based access control and makes it easier for an organization to manage network access.
- You can view the default sign-in policies for both Users and Admins by visiting the Zero Trust Policies pages.
- You can create custom user/admin sign-in policies.
- Edit, copy, deactivate, and delete your Custom and Copied policies.
The policies within Timus' Zero Trust Network Access (ZTNA) security framework are organized and prioritized by its place in the policy table. A policy, which is placed higher in the table, is more prioritized than the other policies.
It means that you are able to prioritize the Timus ZTNA rules by yourself.
It allows for more granular control over access rights, ensuring the right people have the right access at the right time.
The security model of this zero trust approach protects your organization against potential threats by increasing network security.
-
Create an Administrator Sign-In Policy
See moreThis article shows administrator how to create Timus ZTNA's behavior-based administrator sign-in policies and apply them to your network.
Timus ZTNA's policies provide a distinctive and enhanced access control approach to expand your business while maintaining the fundamental aspects of your network security: Infrastructure, Application and Data, User and Device.
To protect your organization and users against today's ever more sophisticated cyber security threats, you can create User/Administrator-based sign-in policies in Timus Manager that automatically respond to any predefined risk level.
On the Admin Sign-in Policies page, you can view the following left to right:
- You can easily navigate the page, view and configure policies using the Search filter located in the page's upper-left corner.
The policies within Timus' Zero Trust Network Access (ZTNA) security framework are organized and prioritized by its place in the policy table. A policy, which is placed higher in the table, is more prioritized than the other Admin Sign-In policies.
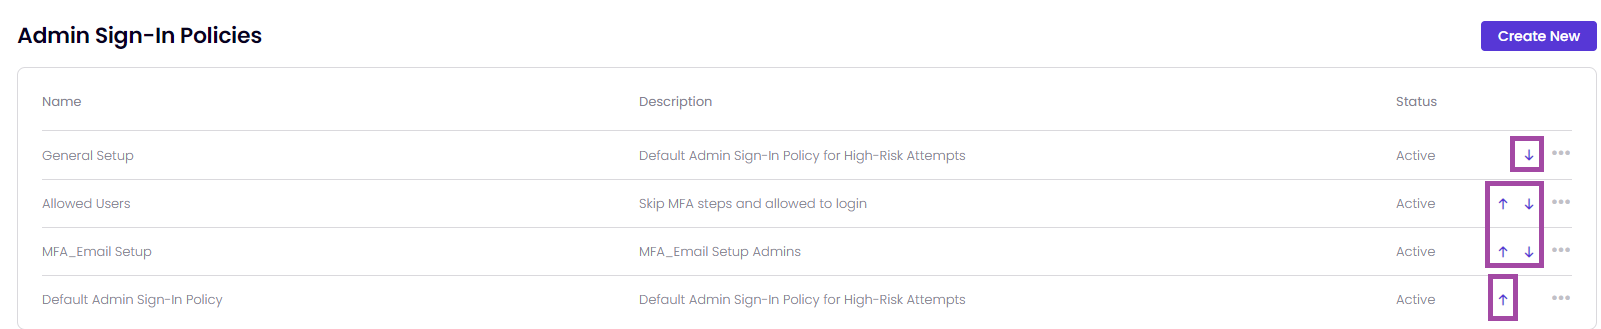
It means that you are able to prioritize the Timus ZTNA rules by yourself.
- You can create custom policies for admins by clicking the Create Admin Sign-in Policy button on the right side of the page.
- In the area on the page with the default and custom policies, you can get general information about the policies, such as Name, Description, and Status.
- The total number of policies defined in your network is displayed just below.
- By clicking the ellipsis icon at the end of the general details of a policy: You can Edit the policy and easily create a new policy with the Copy feature. You can Deactivate and Delete the policy.
You cannot Deactivate or Delete the default administrator sign-in policy.
If you want to create a new Administrator Sign-In/ Login Policy, follow the steps below:- Go to Timus Manager> Zero Trust Security> Admin Sign-in Policies.
- Click the Create Admin Sign-in Policy button on the right side of the page and display the pop-up on the screen with the following tabs:
- Source
- Condition
- Action
- Alerts & Notifications
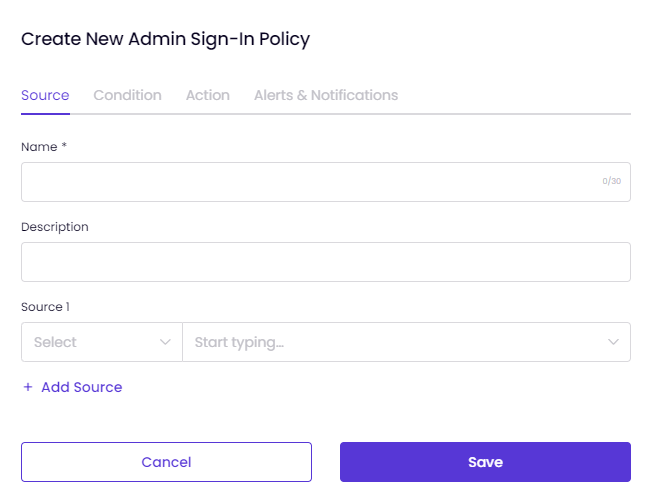
On the Source tab,
- You must first enter a Name and Description for the policy you are about to create. For example, Default Administrator Sign-in Policy Default Administrator Sign-in Policy for High-Risk Attempts
- Click on Select and choose an Administrator.
- If needed, you can select multiple administrators to apply to the policy.
- Click on Save.
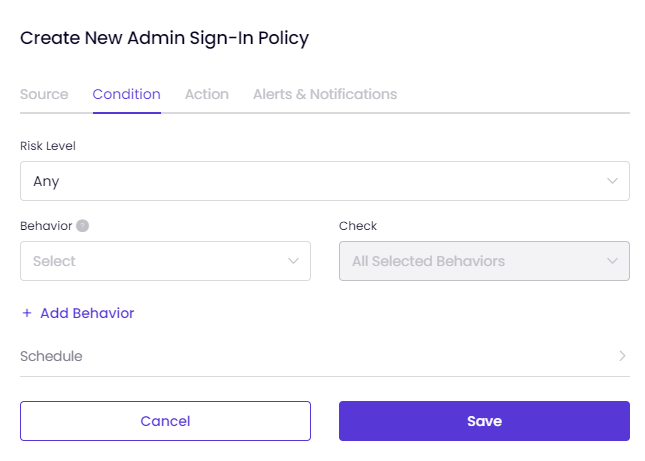
On the Condition tab,
- Set Risk Level as Any, High, Medium, or Low.
- Select the behaviors on which this policy will be applied. More than one can be selected.
- If you move your mouse over the new behavior, a pop-up text will appear displaying information about that specific behavior.
- If you want to set the time, click Schedule. You can set the day(s) and start/ end date here.
- Click Confirm.
When "All Selected Behaviors" is chosen, all selected behaviors such as Untrusted IPs, New Device, and Breached E-mail Address must be active simultaneously for the policy to take the action.
When "Any Selected Behavior" is chosen, at least one of the selected behaviors must be triggered the policy to take the action.
You can consider All Selected Behaviors like "AND &&" and Any Selected Behaviors like "OR ||" as in coding language.
Experience the user-friendly interface of Timus by hovering over the info icons on the policy creation screen:
When you add a behavior to the policy with the add behavior button on the screen and hover over that behavior, you can view the brief explanation about the behavior you added:
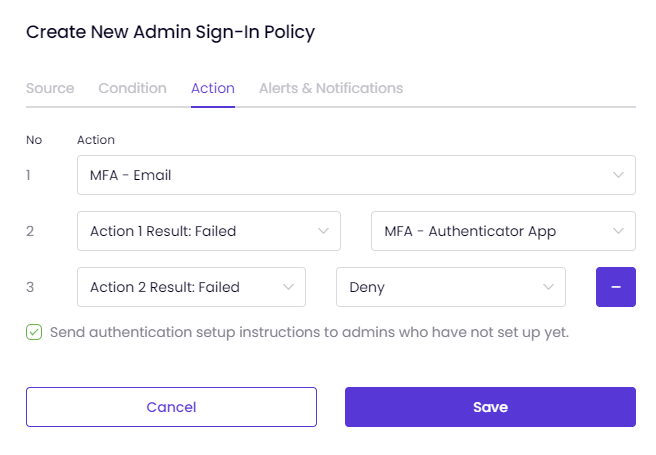
In the Action tab,
Decide what action the system should take when a behavior triggers the policy. The actions defined in the system are as follows:
- Allow
- Deny
- MFA-Email
- MFA Authenticator App
- Deny and Block IP
You can set multiple actions for multifactor authentication with Timus ZTNA.
The actions you select are numbered in the tab shown on the left.
- Select an Action from the drop-down list.
- If you choose is MFA- Authenticator App and MFA- Email actions with multifactor authentication capability, you will see the Add More Actions button on the screen.
So, in a scenario where the first authentication step fails, you can enable another action for login attempts and send authentication setup instructions to administrators who have not completed the setup process.
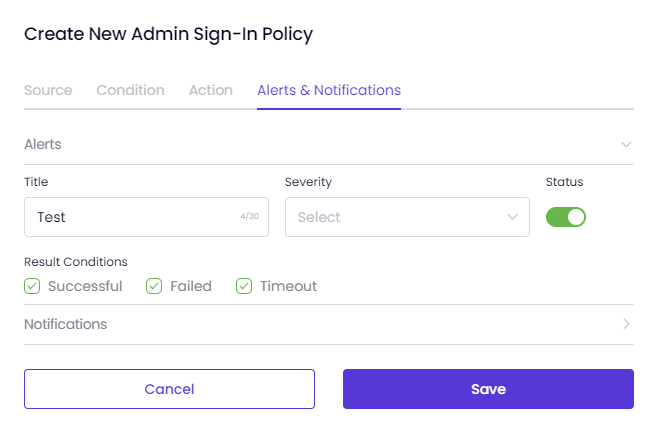
On the Alerts and Notifications tab, you can configure the policy to send Alerts and Notifications each time it is triggered.
- Enter a Title for the policy alert.
- Set the Severity of the alert. Severity can be defined as High/ Medium or Low.
- Set Status ON to enable the alert.
- Specify which Result Conditions will be given an alert. Conditions can be Successful/ Failed or Timeout.
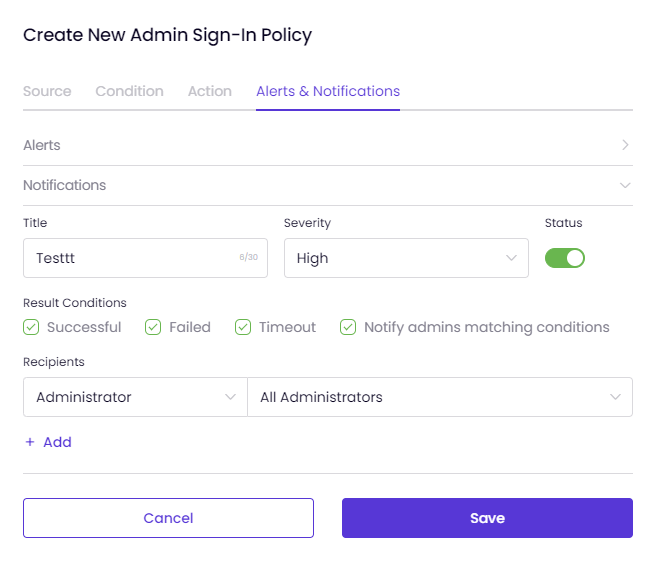
- Click on Notification.
- Enter a Title for notification.
- Set the Severity of notification. Severity can be defined as High/ Medium or Low.
- Set Status ON to enable the notification.
- Decide which Result Conditions will receive notification. Conditions can be Successful/ Failed or Timeout.
- If necessary, check Notify Administrators Matching Conditions to have the system notify the policy-bound user.
- If necessary, enter a Recipients for the notifications to be generated,
- Choose a recipient type: This can be one of your Admin(s) or an External user. More than one recipient can be assigned to the policy.
- When the administrator is selected, all administrators defined in the system are listed by name, and you can also select All Administrators in here.
- When External is selected, enter a Name and E-mail Address.
- Click +Add and view administrators' information, such as Name/ Type and E-mail Address below.
- Clicking Delete at the end of the line deletes the recipient.
- By clicking on Save, you will have created your first Create Admin Sign-in Policy with Timus ZTNA.
- When you open the page, click the ellipsis icon in the default policy row and select Edit from the mini drop-down list.
- Then you can change the configuration of the default policy and reapply it to Timus ZTNA with your final configuration.
- Also, you can create a similar but slightly different policy: If needed, use the Copy feature in this list.
-
Timus Connect Telemetry
See moreThis article explains the details of the Timus Connect Application - TelemetryOverview:- Brief Description of the Feature: The Timus Telemetry Agent is designed to collect detailed information from devices running Windows and macOS operating systems querying via Timus Connect. This data is displayed in the Manager, providing administrators with comprehensive device insights and enhancing device management and device posture assessments.
- Purpose: The Timus Telemetry Agent was developed to address the need for comprehensive device monitoring and security assessment in a rapidly evolving IT environment. By integrating real-time data collection, this feature provides administrators with the tools needed to ensure devices comply with security policies and to detect potential issues early.
- Target Audience: The primary users of this feature are network administrators and IT security teams who use Timus Connect and the Manager. This feature touches on several parts of the Timus SASE solution, including Timus Connect, Manager, and backend improvements for data collection and processing.
Key Benefits:
- Comprehensive Device Insights:
- Administrators can access detailed information about devices, including operating system details, hardware specifications, security settings, and storage devices, providing a holistic view of each device's status. This enables better decision-making and more effective management of the IT environment.
- Enhanced Security Monitoring:
- The integration of Timus Telemetry Agent data into Device Posture Checks allows for continuous monitoring and assessment of device compliance and security posture, enhancing overall network security. This proactive approach helps in identifying and mitigating potential threats before they can cause significant damage.
- Real-Time Data Collection:
- Timus Telemetry Agent continuously collects and updates device data, ensuring that administrators have access to the most current information. This real-time data is crucial for timely decision-making and incident response, allowing organizations to maintain a robust security posture.
- Integration with Existing Security Tools:
- The data collected by Timus Telemetry Agent can be used alongside information from other security tools such as Microsoft Defender, Bitdefender, and SentinelOne, providing a unified approach to device posture management. This integration enhances the effectiveness of existing security measures and ensures comprehensive coverage.
- Customizable Reporting and Policies:
- Administrators can create custom Device Posture Checks and User Sign-in policies based on the data from Timus Connect. This allows for tailored security measures and compliance reporting, ensuring that organizations can adapt their security strategies to meet specific requirements and threats.
Use Cases:
Use Case 1: Identifying and Isolating Malware
Scenario: An IT security team wants to block a suspicious process named "dllhost.exe" running on a user's device, which could compromise the integrity and security of the network.
Implementation:
- The security team accesses the Manager and navigates to the devices table. They select the device and click on "View Device Details."
- In the "Processes" tab, they identify the "dllhost.exe" process.
- They use the "View Process Details" to get more information about the process and its associated ports.
- The security team then creates a Device Posture Check (DPC) using Timus Connect as a data source, specifying "Running Processes" and setting the identifier to "dllhost.exe".
- They configure the DPC to fail if this process is detected, ensuring immediate isolation of the device from the network.
Result:
- The device fails the DPC due to the presence of "dllhost.exe" triggering automated actions such as network isolation. This prevents the spread of malware and protects network resources.
Use Case 2: Ensuring OS Version Compliance
Scenario: An organization needs to ensure all devices running Windows have an OS version that meets their security requirements.
- Device Posture Check Configuration:
- Title: OS Version Compliance
- Assigned Operating System: Windows
- Attribute List:
- Data Source: Timus Connect
- Attribute: OS Version
- Condition: is any of
- Pass Value: Windows 11
Implementation:
- The administrator navigates to the Device Posture Checks section in the Manager portal.
- The administrator creates a new posture check titled "OS Version Compliance."
- They set the data source to Timus Connect and select the attribute "OS Version."
- They configure the condition to pass if the OS version is Windows 11.
- They save the posture check, which will now evaluate connected devices against these criteria.
Result:
- Devices with compliant OS versions pass the check and retain normal access. Devices with non-compliant OS versions are flagged and can be restricted or prompted for updates.
Use Case 3: Monitoring and Restricting Insecure Running Processes
Scenario: An IT security team wants to ensure that certain potentially insecure processes are not running on any device within the network.
- Device Posture Check Configuration:
- Title: Insecure Process Monitoring
- Assigned Operating System: Windows and macOS
- Attribute List:
- Data Source: Timus Connect
- Attribute: Running Processes
- Identifier: AnyDesk
- Condition: contains
- Pass Value: True
Implementation:
- The administrator accesses the Manager and goes to the Device Posture Checks section.
- They created a new posture check titled "Insecure Process Monitoring."
- They set the data source to Timus Connect and select the attribute "Running Processes."
- They enter "AnyDesk" as the identifier and set the condition to "contains" with a pass value of "True."
- The check is saved, and it continuously monitors devices for the running process "AnyDesk"
Result:
- If the process is detected, the device fails the posture check, and appropriate actions can be taken, such as notifying the user to close the application or restricting network access until the process is terminated.
Use Case 4: Ensuring Critical Services are Running
Scenario: A critical service must be running on all devices for compliance and operational reasons.
- Device Posture Check Configuration:
- Title: Critical Service Check
- Assigned Operating System: Windows
- Attribute List:
- Data Source: Timus Connect
- Attribute: Service State
- Identifier: CSFalconService
- Condition: is equal to
- Pass Value: Running
Implementation:
- The administrator goes to the Device Posture Checks section in the Manager portal.
- They create a new posture check titled "Critical Service Check."
- They set the data source to Timus Connect and choose the attribute "Service State."
- They specify "CSFalconService" as the identifier and set the condition to "is equal to" with a pass value of "Running."
- The posture check is saved and monitors devices to ensure the specified service is running.
Result:
- Devices with the critical service running pass the posture check and remain operational. If the service is not running, the device fails the check, triggering alerts or remediation actions.
Use Case 5: Managing Startup Items for Security
- Scenario: The security team wants to ensure that certain applications are not set to start automatically on devices to prevent potential security risks.
- Device Posture Check Configuration:
- Title: Startup Item Compliance
- Assigned Operating System: Windows
- Attribute List:
- Data Source: Timus Connect
- Attribute: Startup Items
- Identifier: PanGPA
- Condition: contains
- Pass Value: True
- Device Posture Check Configuration:
Implementation:
- The administrator navigates to the Device Posture Checks section in the Manager portal.
- They create a new posture check titled "Startup Item Compliance."
- They set the data source to Timus Connect and select the attribute "Startup Items."
- They enter "PanGPA" as the identifier and set the condition to "contains" with a pass value of "True."
- The posture check is saved and monitors startup items on devices.
Result:
- If the identified startup item is present, the device fails the posture check, and actions such as disabling the startup item or alerting the user can be taken to mitigate the security risk.
Competitive Analysis:
- Comparison with Competitors: The Timus Telemetry Agent feature in Timus Connect distinguishes itself from similar products offered by competitors such as Perimeter 81, Todyl, Fortigate, Zscaler, and Check Point through several key aspects:
- Detailed Data Collection:
- Timus Connect: Provides comprehensive data collection from devices, including operating system details, hardware specifications, security settings, and more.
- Perimeter 81: Offers basic telemetry but lacks the depth of data collection provided by Timus Connect.
- Todyl: Provides some telemetry data but does not offer the same level of detail and integration as Timus Connect.
- Fortigate: Supports basic device information but lacks the comprehensive data collection capabilities of Timus Connect.
- Zscaler: Offers telemetry data but does not match the granularity and flexibility of Timus Connect’s options.
- Check Point: Provides basic telemetry features but lacks the depth of customization and detail available in Timus Connect.
- Integration with Device Posture Checks:
- Timus Connect: Seamlessly integrates telemetry data into Device Posture Checks, enhancing security monitoring and compliance.
- Perimeter 81: Offers basic integration but lacks the comprehensive posture check capabilities of Timus Connect.
- Todyl: Provides some integration options but does not offer the same level of seamless integration with posture checks.
- Fortigate: Limited integration with posture checks compared to Timus Connect.
- Zscaler: Basic integration with posture checks but lacks the advanced features of Timus Connect.
- Check Point: Offers limited integration with posture checks, not matching the comprehensive approach of Timus Connect.
- Real-Time Data Collection:
- Timus Connect: Continuously collects and updates device data, providing real-time insights.
- Perimeter 81: Offers periodic updates but lacks continuous real-time data collection.
- Todyl: Provides regular updates but does not offer continuous real-time data collection.
- Fortigate: Supports periodic data collection but lacks real-time updates.
- Zscaler: Provides basic real-time updates but not as comprehensive as Timus Connect.
- Check Point: Offers periodic updates, lacking continuous real-time data collection.
- Unique Selling Points:
- Comprehensive Device Insights:
- Feature: Detailed information on operating systems, hardware, security settings, and storage devices.
- Benefit: Enables better decision-making and more effective IT management.
- Enhanced Security Monitoring:
- Feature: Integration with Device Posture Checks for continuous monitoring and assessment.
- Benefit: Improves overall network security by identifying and mitigating potential threats early.
- Real-Time Data Collection:
- Feature: Continuous data collection and updates.
- Benefit: Provides the most current information for timely decision-making and incident response.
- Integration with Existing Security Tools:
- Feature: Seamless integration with tools like Microsoft Defender, Bitdefender, and SentinelOne.
- Benefit: Enhances the effectiveness of existing security measures.
- Customizable Reporting and Policies:
- Feature: Ability to create custom posture checks and policies based on collected data.
- Benefit: Allows for tailored security measures and compliance reporting.
- Comprehensive Device Insights:
FAQs:
- Question 1: What is the Timus Telemetry Agent feature?
- Answer: The Timus Telemetry Agent collects detailed information from Windows and macOS devices using a query engine while connected to Timus Connect, displaying this data in the Manager portal for comprehensive device insights.
- Question 2: How does the Timus Telemetry Agent enhance security monitoring?
- Answer: By integrating telemetry data into Device Posture Checks, the Timus Telemetry Agent allows for continuous monitoring and assessment of device compliance and security posture, improving overall network security.
- Question 3: How often is the device data updated?
- Answer: The Timus Telemetry Agent continuously collects and updates device data every 5 minutes, ensuring administrators have access to the most current information.
- Question 4: How can administrators create custom posture checks using Timus Telemetry Agent data?
- Answer: Administrators can configure posture checks in the Manager using attributes from Timus Connect as a Data Source, determining pass/fail statuses and generating detailed compliance reports.
Visuals and Diagrams:
Step 1: Accessing Device Details
- Navigate to Devices Table:
- In the Manager portal, navigate to the "Devices" tab to view a list of all devices connected to Timus Connect.
- Select Device:
- Locate the device with the OS set to Windows or macOS. Click on the three dots next to the device entry.
- View Device Details:
- From the dropdown menu, select "View Device Details." This action opens a detailed view of the selected device.
Step 2: Overview Tab
- Overview Section:
- This section provides a general overview of the device, displaying key information such as the last sync time.
For Windows Devices:
- Operating System Information:
- Includes details like OS name, version, build, platform, computer name, user, and user ID.
- Hardware Information:
- Displays hardware specifications including hostname, CPU brand, CPU physical cores, CPU logical cores, CPU sockets, physical memory, and serial number.
- Security Information:
- Shows security-related data such as firewall status, auto-update, antivirus, internet settings, Windows Security Center Service, and UAC. It also includes specific security product information, such as type, state, timestamp, and whether the signature is up-to-date.
- Storage Devices:
- Lists the storage devices on the computer, displaying disk UUIDs, type, usage, file system, and encryption status.
For macOS Devices:
- Operating System Information:
- Includes details like OS name, version, build, platform, computer name, user, and user ID.
- Hardware Information:
- Displays hardware specifications including hostname, CPU brand, CPU physical cores, CPU logical cores, CPU sockets, physical memory, and serial number.
- Security Information:
- Shows security-related data such as Firewall, Firewall Version, Firewall Unload, Firewall Logging, Logging State, Side Mode, Stealth Mode, Gatekeeper Status, Gatekeeper Dev Status, Version, Gatekeeper Opac, and FileVault.
- Storage Devices:
- Lists the storage devices on the computer, displaying disk UUIDs, type, usage, file system, encryption status, and path.
Step 3: Navigating Network Tab:
Displays network interface details such as Interface, FriendlyName, Address, Mask, Type, and MAC. Clicking on "Details" provides more in-depth network information.
For Windows Devices:
- Displays detailed information about the WiFi interface, including Interface number, MAC address, MTU, Metric, Description, Connection ID, DHCP Server, DNS Domain, DNS Domain Suffix Search Order, DNS Hostname, and DNS Server Search Order.
For macOS Devices:
- Displays detailed information about the EN0 interface, including Interface number, MAC address, MTU, and Metric.
Step 4: Navigating Programs Tab
Displays installed programs on the device with the following columns: Program Name, Version, Install Location, Publisher, Install Date, and Last Runtime.
For Windows Devices:
- Displayed Columns:
- Program Name
- Version
- Install Location
- Publisher
- Install Date
For macOS Devices:
- Displayed Columns:
- Program Name
- Version
- Install Location
- Publisher
- Last Runtime
Step 5: Navigating Processes Tab
Displays running processes on the device with the following columns for both Windows and macOS:
- PID (Process ID)
- Name
- Path
- State
Clicking on the three dots next to a process entry provides options to view more detailed information about the process.
- View Process Details: Opens a detailed view of the selected process.
- View Listening Ports: This option is active only if the process has listening ports.
Viewing Process and Listening Port Details
- Clicking "View Process Details" under the three dots (ellipsis) opens a modal displaying detailed information about the selected process.
- If the process has listening ports, clicking "View Listening Ports" opens a modal displaying the details of these ports.
Step 6: Navigating Services Tab
In the Services tab, you can see the services running on the device. The information displayed varies slightly between Windows and macOS devices:
For Windows Devices:
- Name: The name of the service.
- Type: The type of service.
- Display Name: The display name of the service.
- Path: The file path to the service executable.
- Status: The current status of the service (e.g., running, stopped).
- PID: The process ID of the service.
- Startup Type: Indicates how the service is started (e.g., automatic, manual).
For macOS Devices:
- Name: The name of the service.
- Type: The type of service.
- Path: The file path to the service executable.
- Status: The current status of the service (e.g., running, stopped).
- PID: The process ID of the service.
Step 7: Navigating Startup Items Tab
For Windows devices, the Startup Items tab displays a table with information about programs that are configured to run when the system starts. The table includes the following columns:
- Name: The name of the startup item.
- Path: The file path to the startup program.
- Args: Any arguments passed to the startup program.
- Status: Indicates whether the startup item is enabled or disabled.
- Username: The user account under which the startup item runs.
Step 8: Navigating Routes Tab
In the Routes tab, routing information for both Windows and macOS devices is displayed. The table includes the following columns:
- Destination: The destination IP address.
- Netmask: The subnet mask.
- Gateway: The gateway IP address.
- Interface: The network interface used.
- MTU: The Maximum Transmission Unit size.
- Metric: The routing metric.
- Type: The type of route (e.g., remote).
Step 9: Creating or Editing Device Posture Checks:
- Navigate to Zero Trust Security → Device Posture Checks to create or edit a device posture check.
- When adding attributes, select Timus Connect as the Data Source.
- Choose from available attributes such as Antivirus State, Disk Encryption, Firewall, Operating System, Running Processes, Service State, Startup Items, and Timus Connect Installed.
- If one of the Running Processes, Service State, or Startup Items) is selected, an Identifier field appears.
- Enter the specific process, service, or startup item name in the Identifier field.
- Define the condition and the pass value for the posture check based on the selected attribute and identifier.
The reports in Manager → Insights → Device Posture Reports will display device posture checks created for attributes from Timus Connect. This allows administrators to monitor compliance and security status effectively, ensuring that all devices meet the required posture standards based on the detailed and specific checks configured.