How can we help?
Find help articles, troubleshooting guides, and tutorials
Search
Common searches:
Find help articles, troubleshooting guides, and tutorials
Common searches:
Video tutorials explaining how to set up various aspect of Timus tutorials listed on this Knowledge Base page
Explore our YouTube channel for how-to videos, partner use, and insights on Timus and the MSP space.
This exam assesses your proficiency and understanding of some of the key functionalities of the Timus’ Zero Trust Network Security Solution.
Welcome to our explainer videos page! Here, you'll find a variety of guides that walk you through essential features and configurations of Timus Networks. These quick, easy-to-follow videos are designed to help you with everything from setup and configuration to more advanced topics, making your experience with Timus smoother and more efficient. Whether you're a beginner or looking for advanced tips, these videos will guide you every step of the way.
The Zero trust framework is build around the mindset where you never trust, always verify. See the two minute video below showing how Timus verifies key user behaviors to ensure you are who you say you are.
The Timus Gateway hosts a cloud firewall that performs various functions. See below video showing configuration of an IPsec tunnel from the gateway to an on-premise firewall, giving users connectivity to data no matter where it lives.
With users working from anywhere, the security perimeter is wherever the user is. The Timus adaptive cloud firewall rules follow the user and their identity, not just their device or location, enabling true secure access at the edge.
Each Timus gateway comes standard with a private, static IP address. Benefits include: - Lock down SaaS apps via IP Whitelisting - Single point of entry to the network, providing deeper visibility - Further defining conditional access
At the network layer, Timus' Secure Web Gateway enables web filtering, content blocking and anti-virus to ensure that users are accessing safe applications and sites while working.
This article explains an overview of the primary dashboard within the Timus Manager. Including key indicators, actionable items & insights
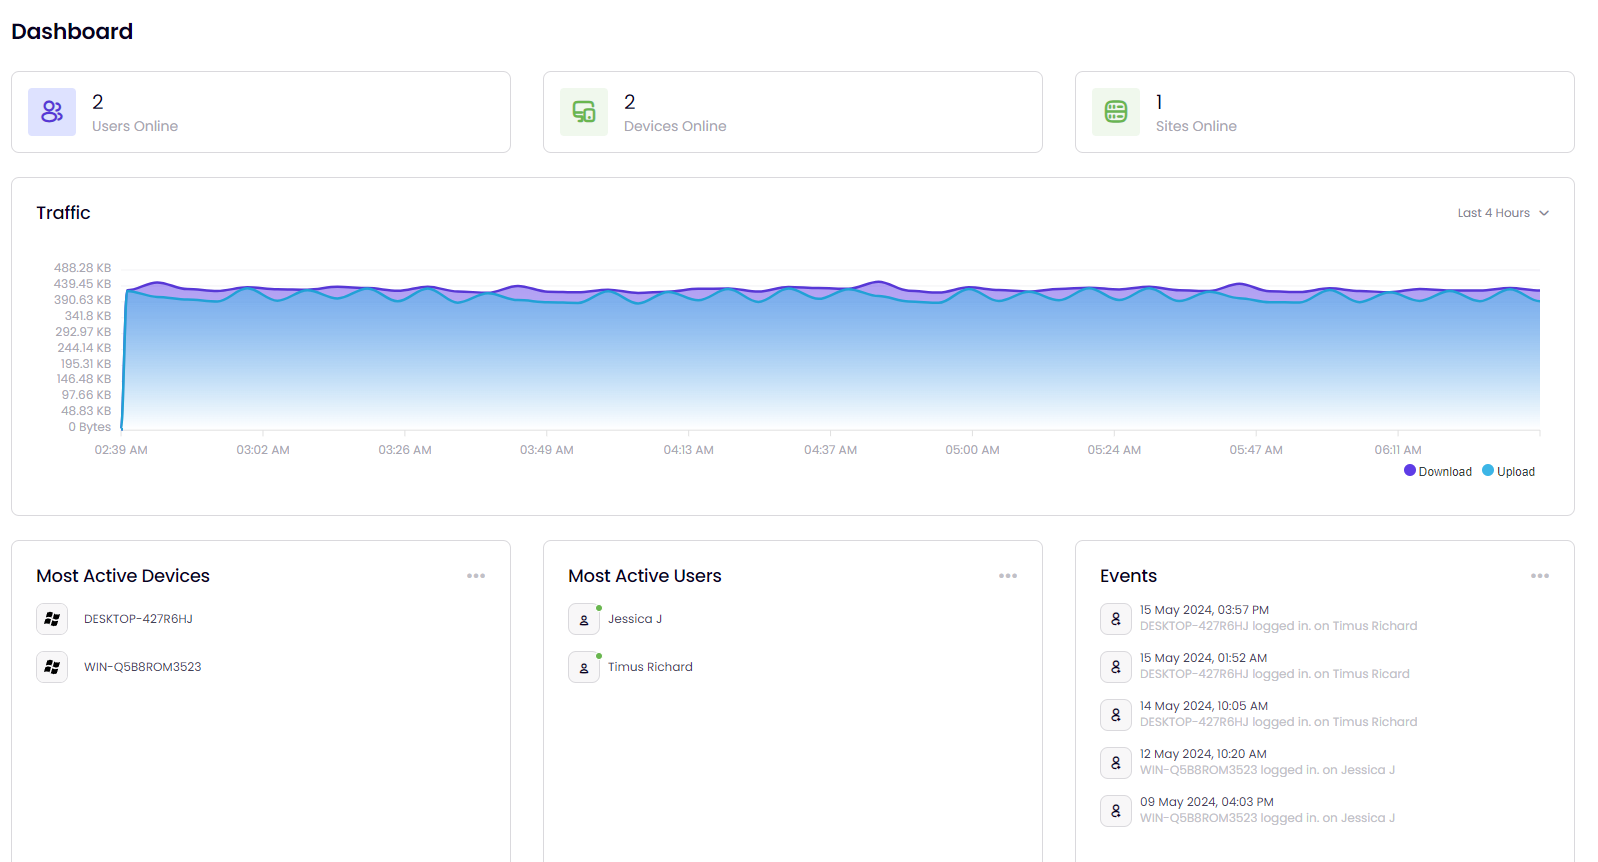
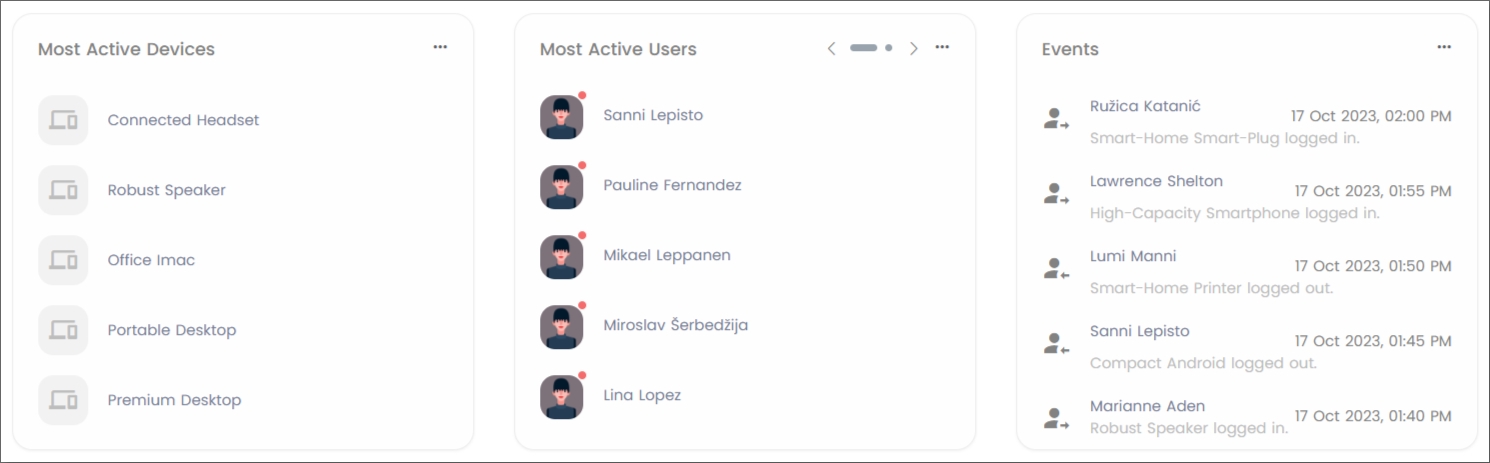
The Timus Dashboard is part of Timus Manager. It allows the administrator a comprehensive view of the network, including active users, devices, sites, and events occurring on the client network.
Dashboard components include:
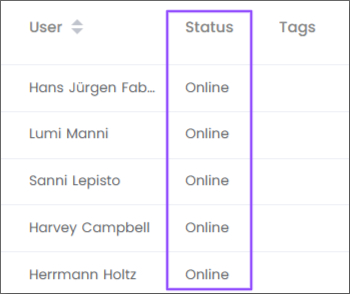
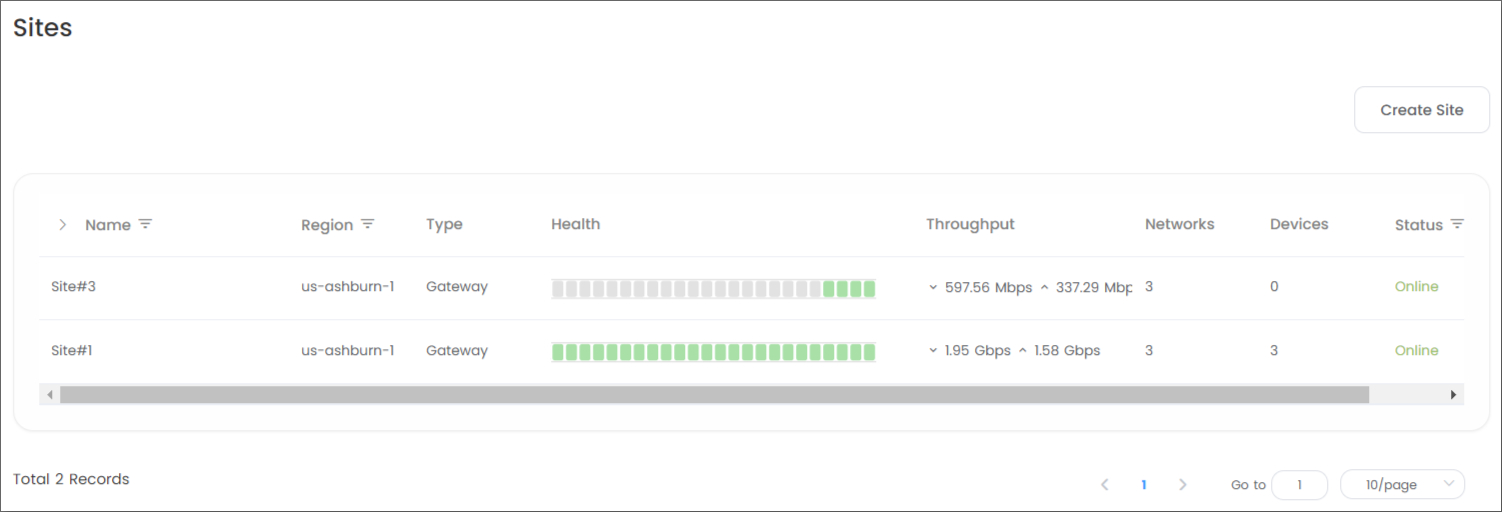
By clicking one of these areas, such as Users Online, you will be redirected to the Users screen. On this screen, the status of the online users within your network is displayed as Active.
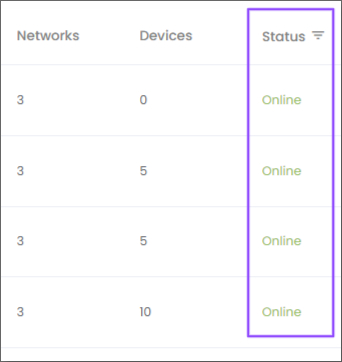
Similarly, for Devices Online or Sites Online, you can view the devices and sites listed as Online in the Status section on the respective Devices or Sites screens that will open after clicking.
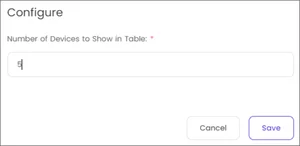
Most Active Devices: displays the devices that frequently login and out of the network. A maximum of 30 devices can be displayed in the widget.
Most Active Users: displays in order of the users who frequently login and out of the network. A maximum of 30 users can be displayed in the widget.
Events: displays the login and out of users on the network. A maximum of 30 events can be displayed in the widget.
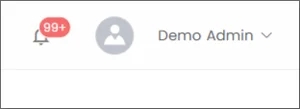
Alerts: shows the total number of events in the upper right corner of the Dashboard as shown in the image below.
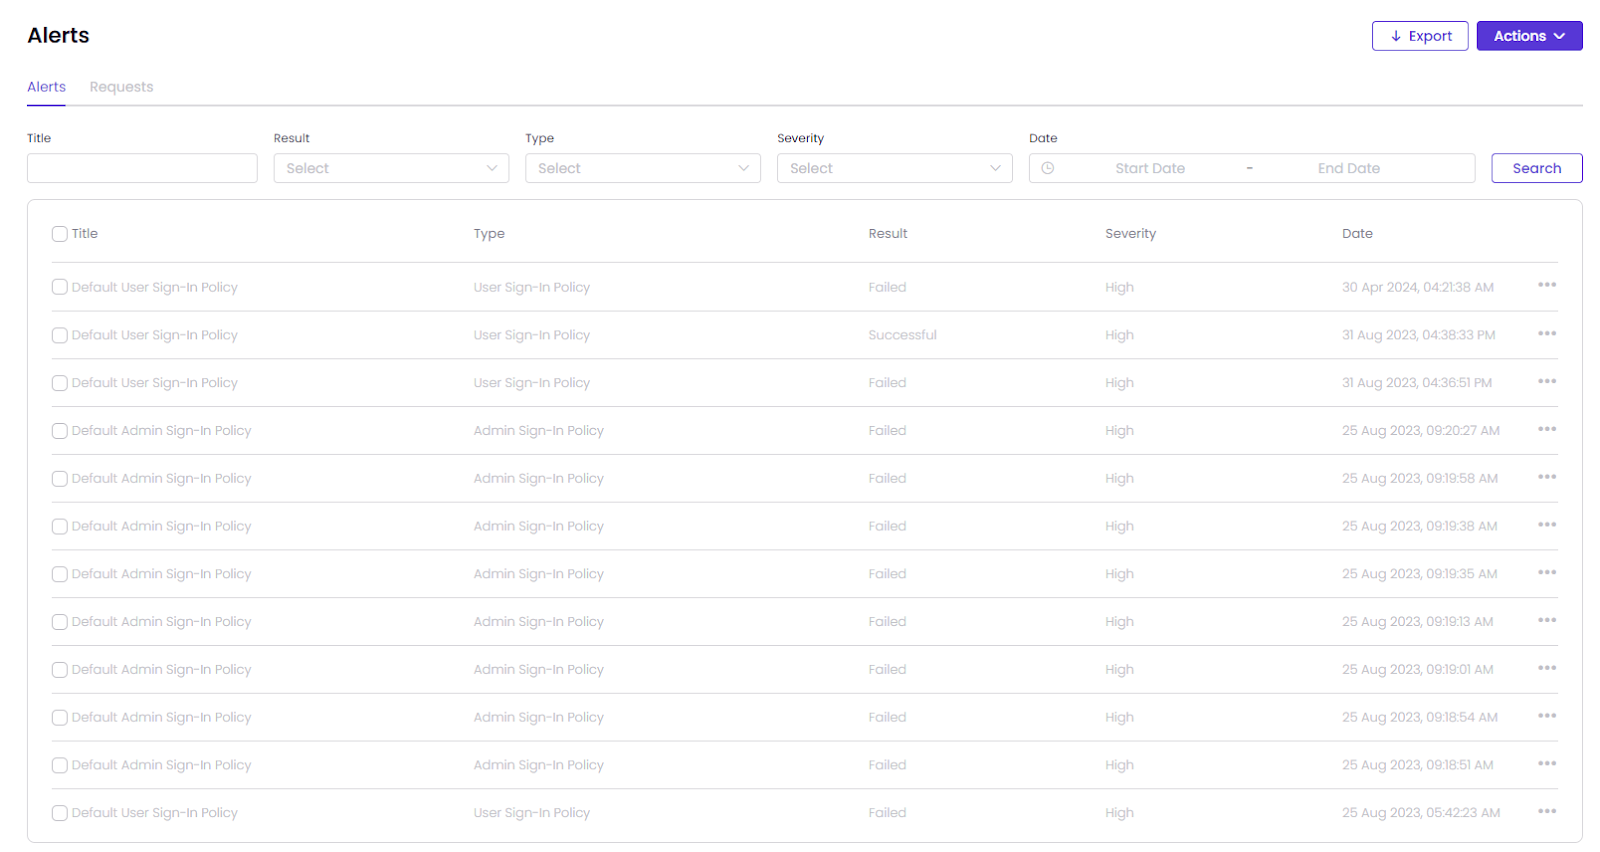
These alerts are generated in response to the user/admin sign-in policies under the Zero Trust Security section.
When you click on the icon, you will be directed to the Alerts page, where you can get more detailed information about the alert.
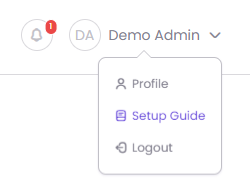
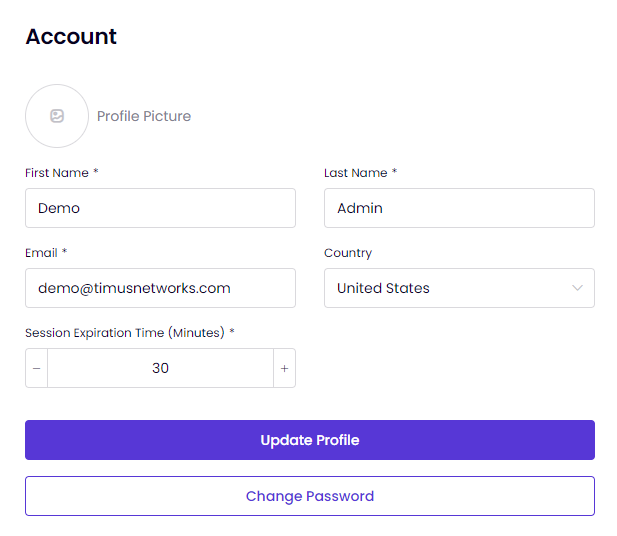
Profile: Located in the upper right corner of the Dashboard allows you to edit your Account information, Change Password, and change the Session Expiration Time.
Additionally, you can access the Setup Guide or Log out of the interface here.
The partner portal dashboard will provide visibility into customers' relevant information & all data pertaining to your partnership with Timus Networks.
MSPs will leverage the Timus Networks partner portal as their primary dashboard for day to day management of the Timus solution. Within the portal, you will be able to add, remove & manage all clients for both billing and technical management.
Link to - partner portal
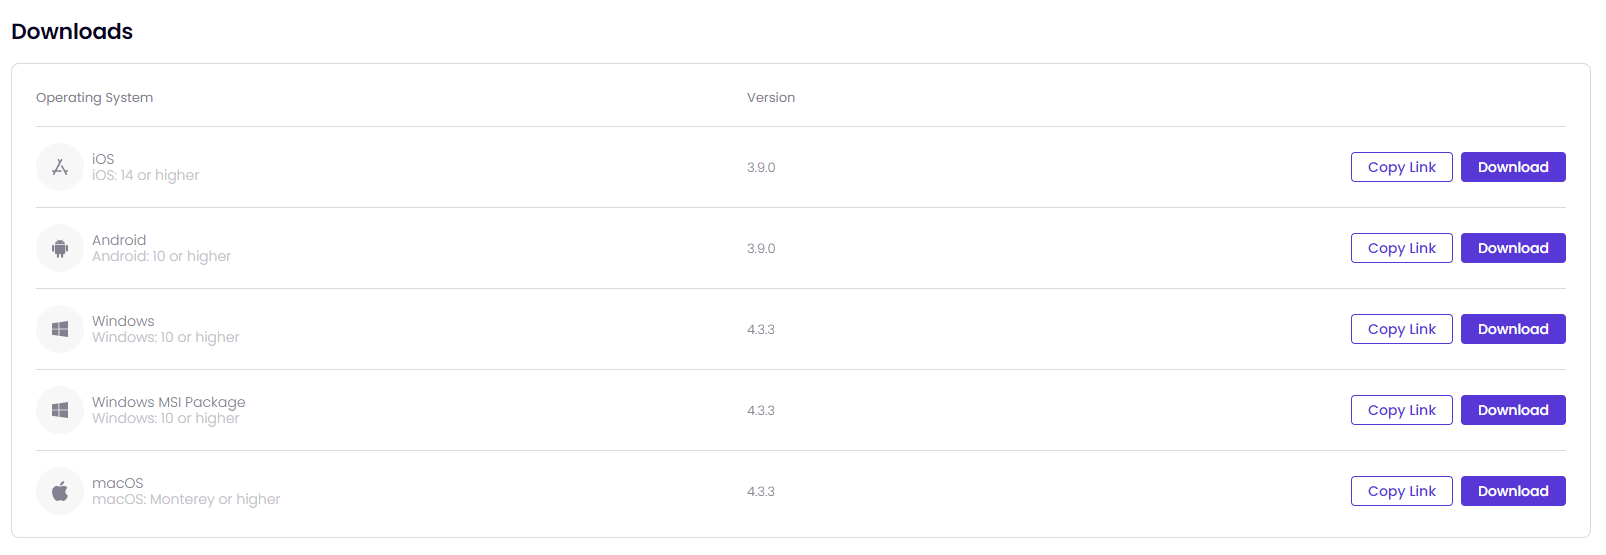
For more information on Timus Connect App versions for different operating systems, go to:
ChaCha20 encryption is used for WireGuard.
AES-256-CBC encryption is used for OpenVPN.
When installing Timus Connect App onto desktop devices for the first time, the account must have administrator permission in order to install the application onto the device.
If Timus Connect App's background service is completely stopped for any reason, administrator permission will be required to access the application.
To change your password:
On the Settings menu,
Split tunnel configuration works on Windows when the tunnel protocol is WireGuard.
On the Support menu, you can
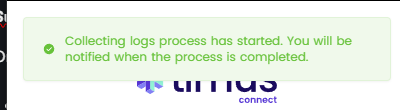
You will get a notification message as shown in the image below once you click on Collect log. This process can take up to 10 seconds.
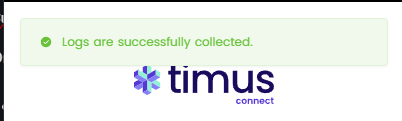
Once the log file has been successfully created, you will see the pop-up message as shown in the image below.
This document is a guide explaining the use of the Timus Connect for macOS® application.
This application secures your connection by establishing an encrypted tunnel to the Timus Platform.
Timus Connect App supports macOS Monterey or higher versions.
When installing Timus Connect App for the first time, the account must have administrator permission in order to install the application onto the device.
If Timus Connect App's background service is completely stopped for any reason, administrator permission will be required to access the application.
Administrator permission is not required for version updates.


If this account is synchronized from a directory service like Microsoft Entra ID(Azure AD), Okta, or Google Workspace, at this moment the login screen will be forwarded to the login screen of that directory service.

If you trigger a user sign-in policy of Timus Manager with a behavior when you try to login, you may encounter a different authentication method like two-factor authentication.
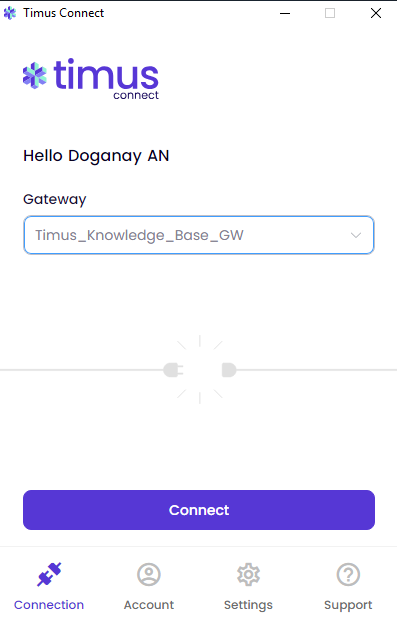
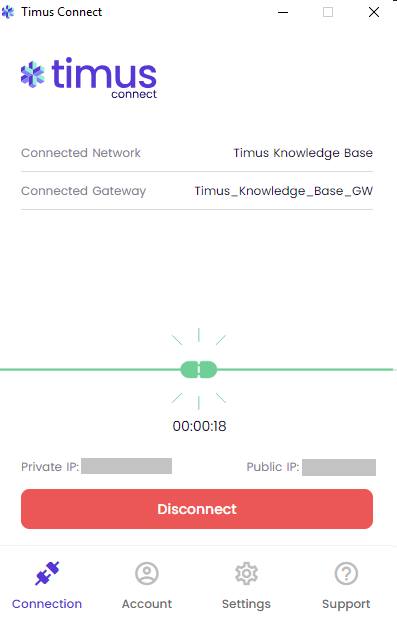
The screen that opens is the application's main screen, you will see the following menu items:
Follow the steps below to establish a connection by using the Timus Connect Windows application:
The round-trip traffic duration to each active gateway will be displayed next to the gateway. The lower the duration, the faster the connection.

On the Account menu, you can

On the Settings menu,

If you are unable to modify or turn features on or off, it indicates that the administrator has closed that feature to user selection based on their preference.
Split tunnel configuration works on macOS when the tunnel protocol is WireGuard.
On the Support menu, you can
Once you have any isues with the Timus Connect Application, you click on Collect log. it will want you to select a folder to create a log file, which will have all the .log files needed for troubleshooting. You can send the file to one of our technical support specialists to have it analyzed.

You will get a notification message as shown in the image below once you click on Collect log. This process can take up to 10 seconds.

Once the log file has been successfully created, you will see the pop-up message as shown in the image below.

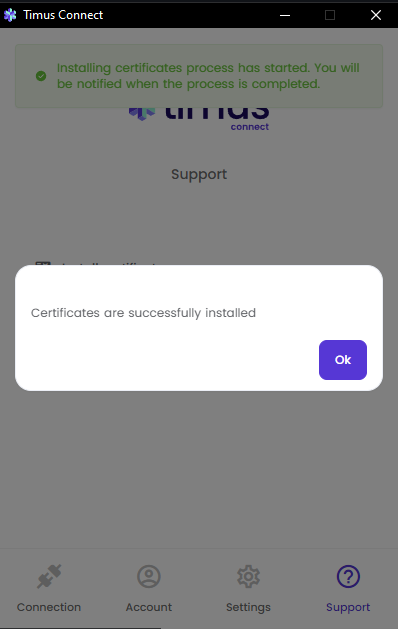
To install an SSL Certificate, follow these steps:
The SSL Certificate can be installed by clicking "Install Certificate" on the Support menu. However, in order for the SSL Certificate to function properly, its trust settings must be configured as follows.


Please note that altering the trust settings of any certificate should be done with caution. Always ensure that the certificate is from a reliable source.
This document is a guide explaining the use of Timus Connect for iOS application.
This application secures your connection by establishing an encrypted tunnel to the Timus Platform.
Timus Connect App supports iOS 14 or later versions.


If you trigger a user sign-in policy of Timus Manager with a behavior when you try to login, you may encounter a different authentication method like two-factor authentication.
The screen that opens is the application's main screen. On this screen, you will see the following menu items:
Follow the steps below to establish a connection by using the Timus Connect Windows application:
If this account is synchronized from a directory service like Microsoft Entra ID(Azure AD), Okta, or Google Workspace, at this moment the login screen will be forwarded to the login screen of that directory service.

If you have just connected to one of the gateways, it will ask for your permission as shown in the image below to be able to let you use the Timus Connect iOS Application. You need to click on Allow to continue.

If you click on Don't Allow not to give the permission for the Timus Connect iOS Application, you will not able to connect to your gateways.

The round-trip traffic duration to each active gateway will be displayed next to the gateway. The lower the duration, the faster the connection.


On the Support menu, you can

If you are unable to modify or turn features on or off, it indicates that the administrator has closed that feature to user selection based on their preference.

This application secures your connection by establishing an encrypted tunnel to the Timus Platform.
Timus Connect App supports Android 10 or higher versions.
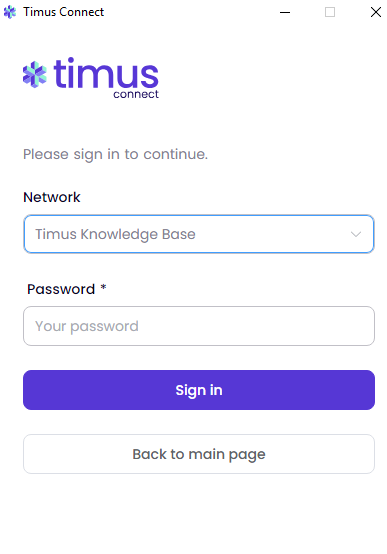
• The e-mail address screen will appear. Enter the e-mail address of your Timus account to sign into your network.

In the next screen, Select a Network and enter your Password to login. If there is only one network, that network will be selected automatically.
If this account is synchronized from a directory service like Microsoft Entra ID(Azure AD), Okta, or Google Workspace, at this moment the login screen will be forwarded to the login screen of that directory service.

If you trigger a user sign-in policy of Timus Manager with a behavior when you try to login, you may encounter a different authentication method like two-factor authentication.
The screen that opens is the application's main screen will have the following menu items:
Follow the steps below to establish a connection by using the Timus Connect Android™ application:
The round-trip traffic duration to each active gateway will be displayed next to the gateway. The lower the duration, the faster the connection.


On the Support menu, you can:


If you are unable to modify or turn features on or off, it indicates that the administrator has closed that feature to user selection based on their preference.
Split tunnel configuration works on Android when the tunnel protocol is WireGuard.
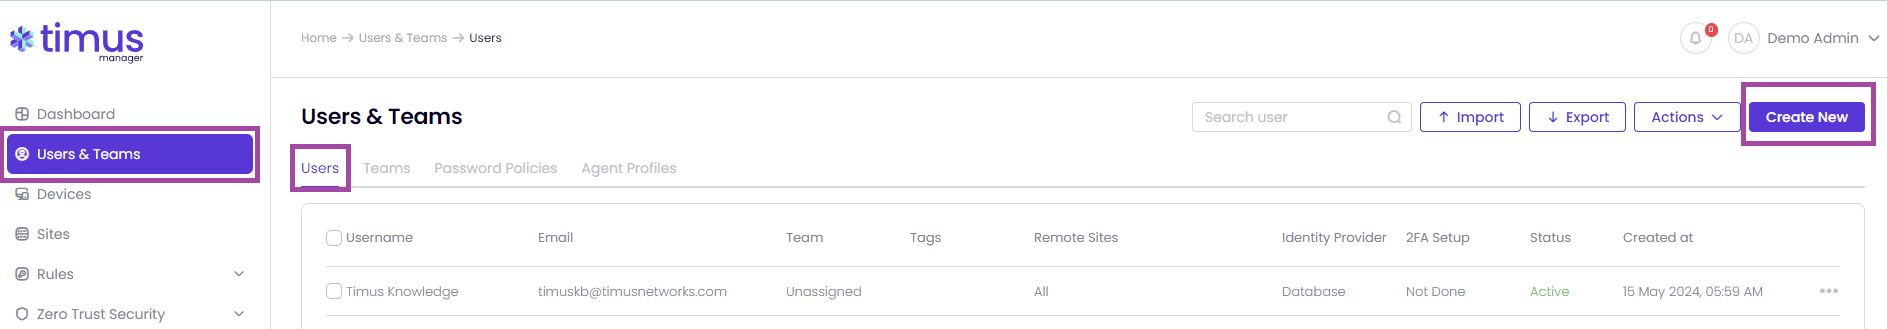
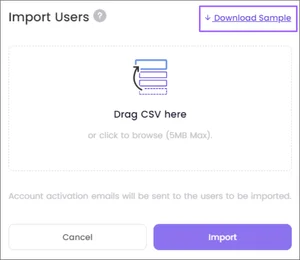
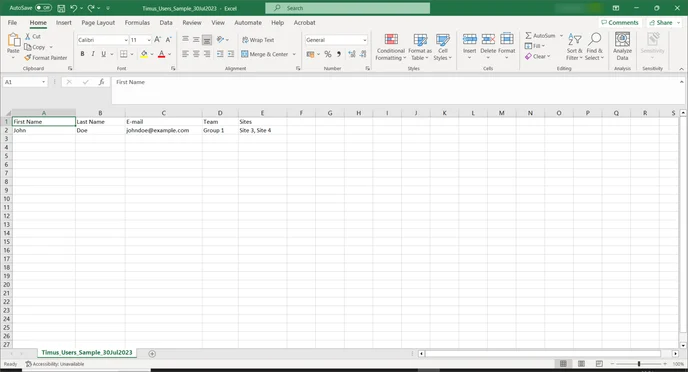
There are three methods for creating users: manually, through importing, or by using directory synchronization
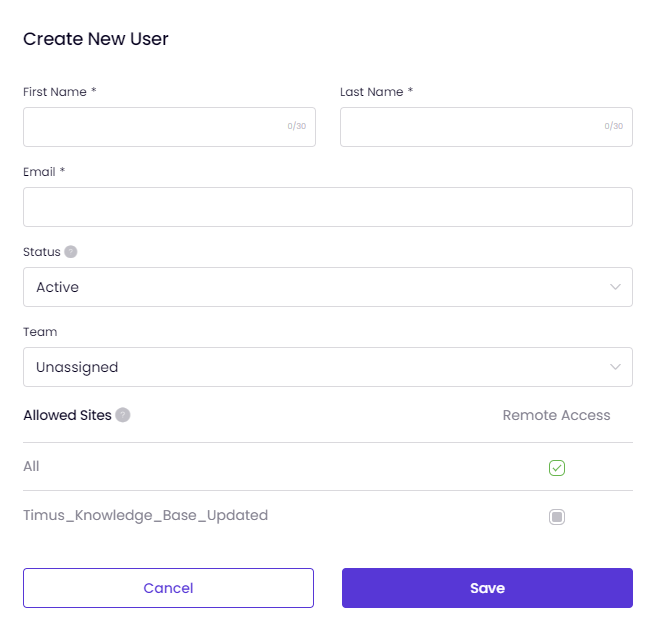
Follow these steps to manually add new user(s) on your network with Timus Manager:
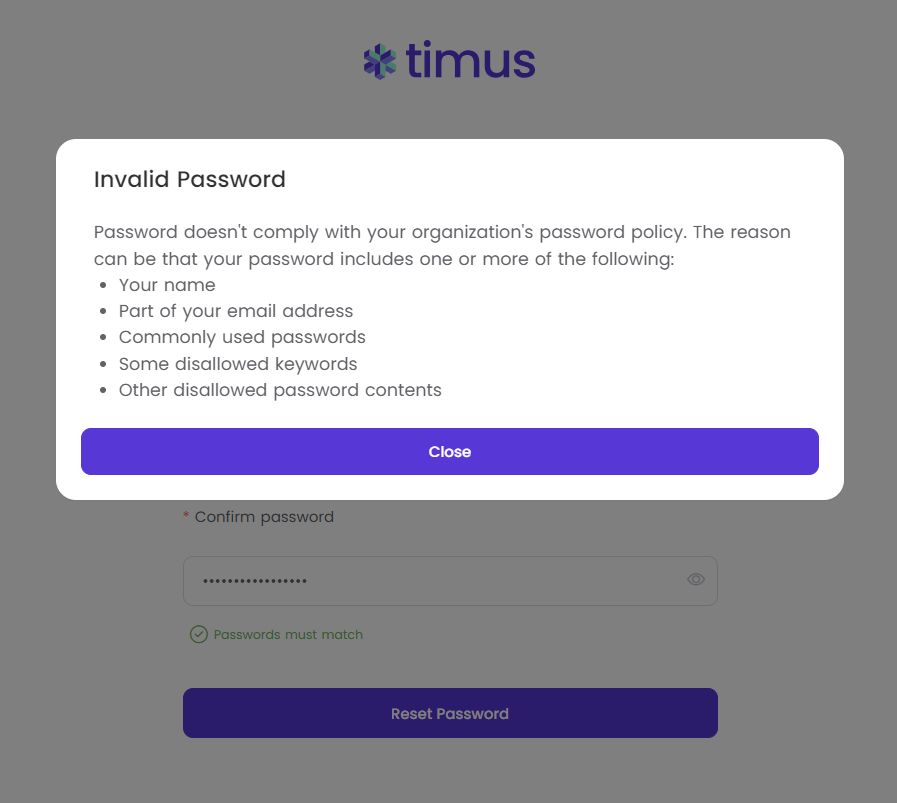
In this example, I have used "john" in my password. Therefore, I have seen Invalid Password pop-up on my screen.
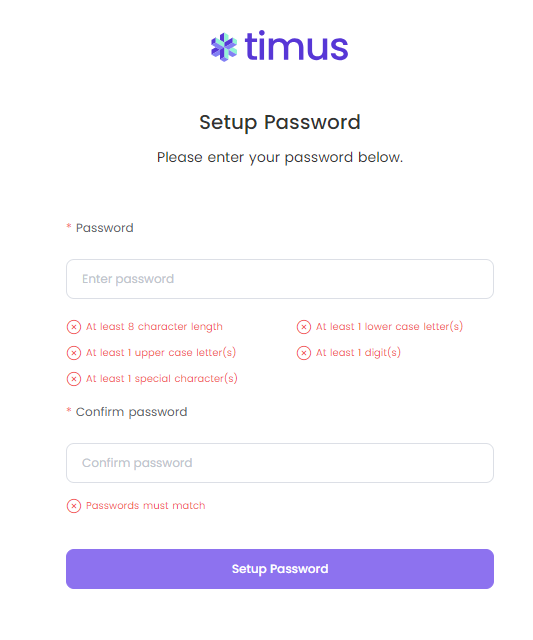
You need to set your Password Policies, which totally depend on the network admins, for the users.
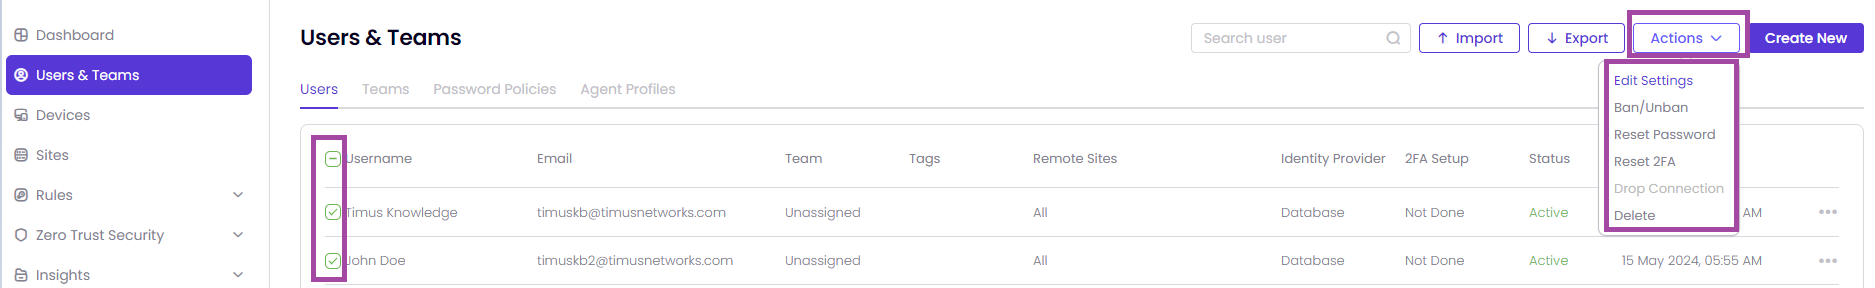
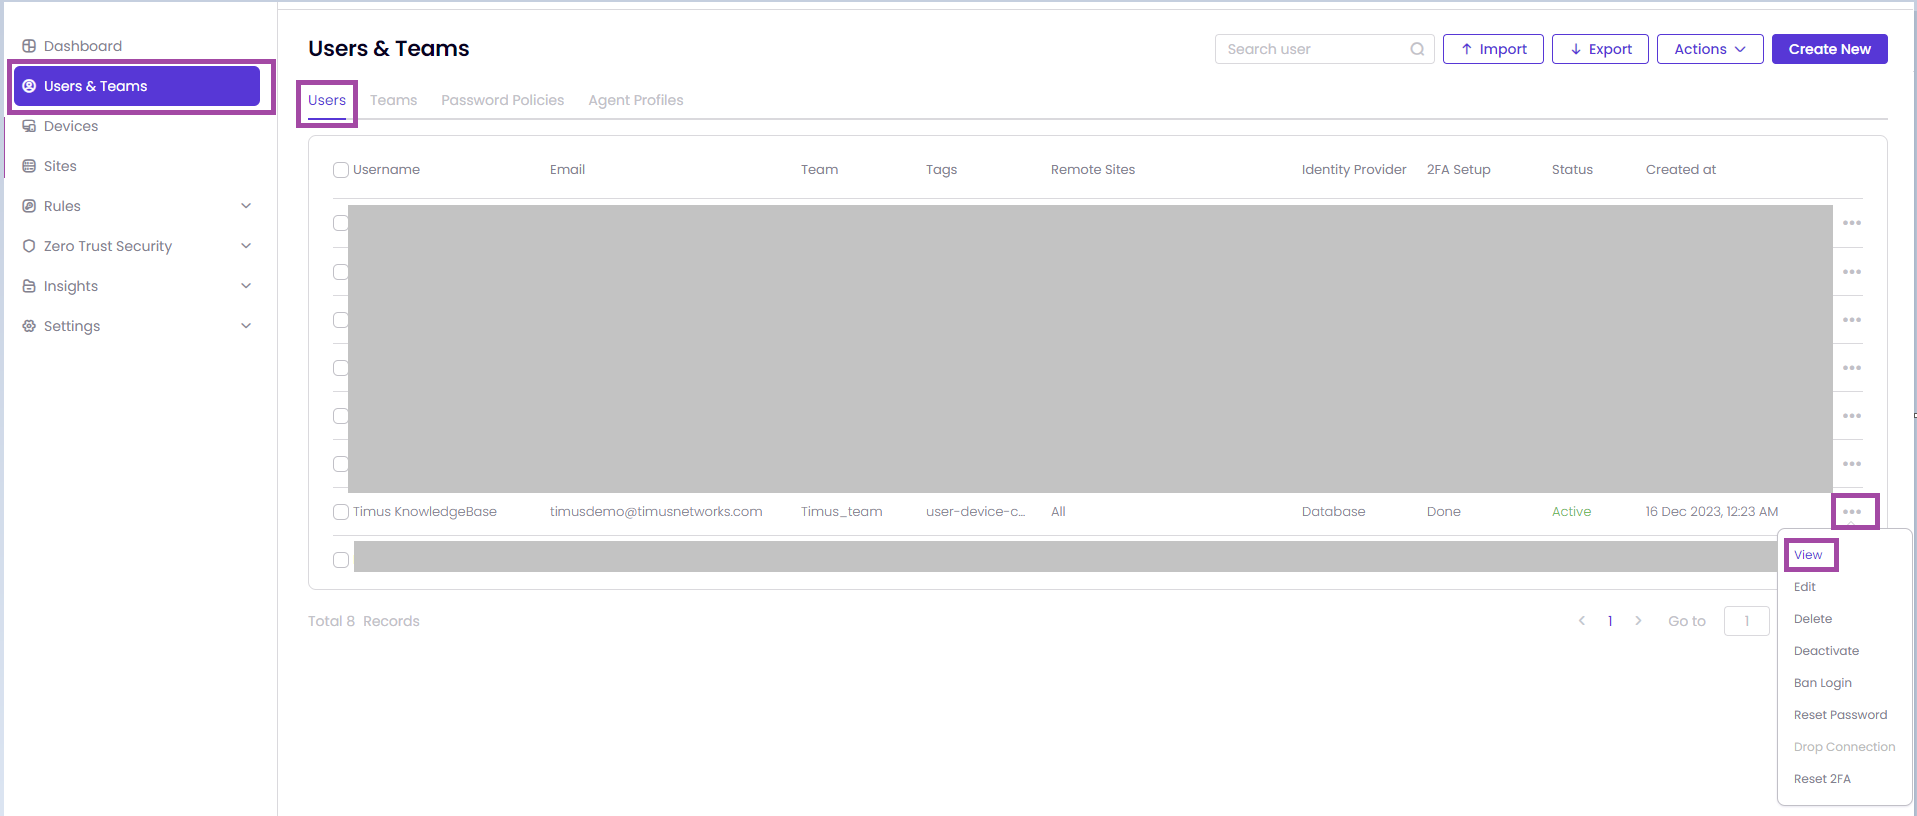
This article contains guidance on managing users, executing bulk actions, and resetting passwords.
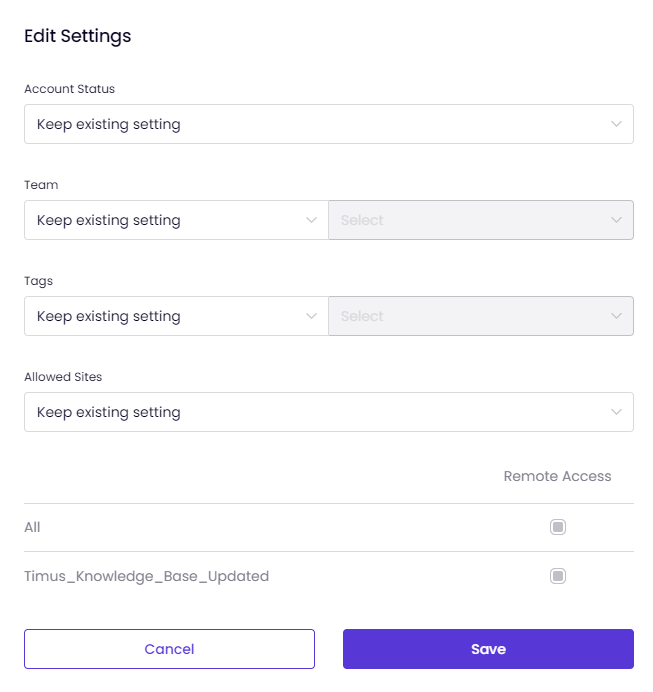
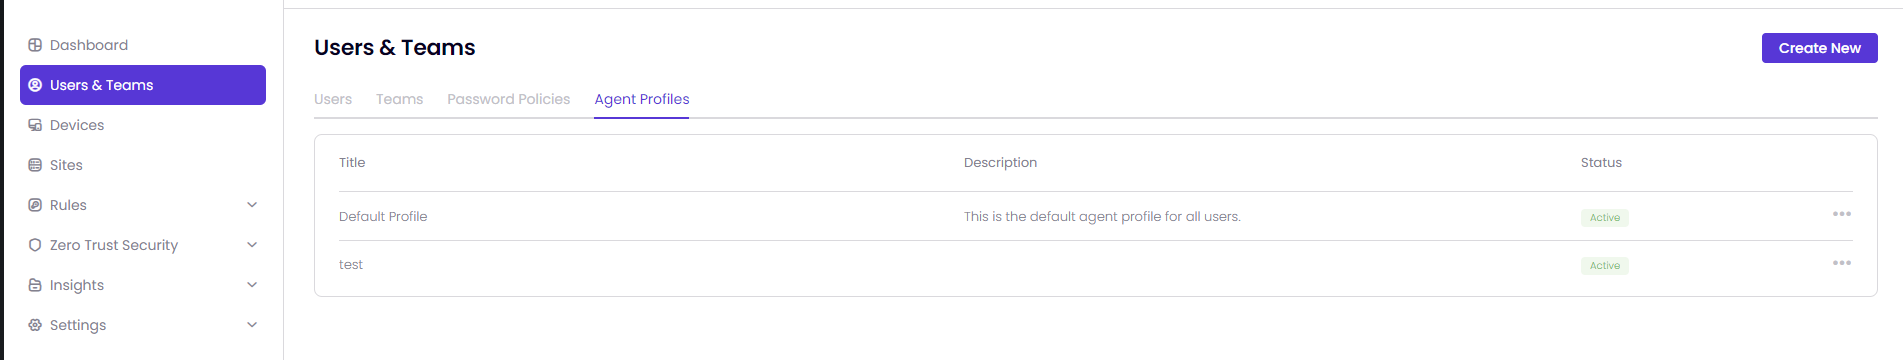
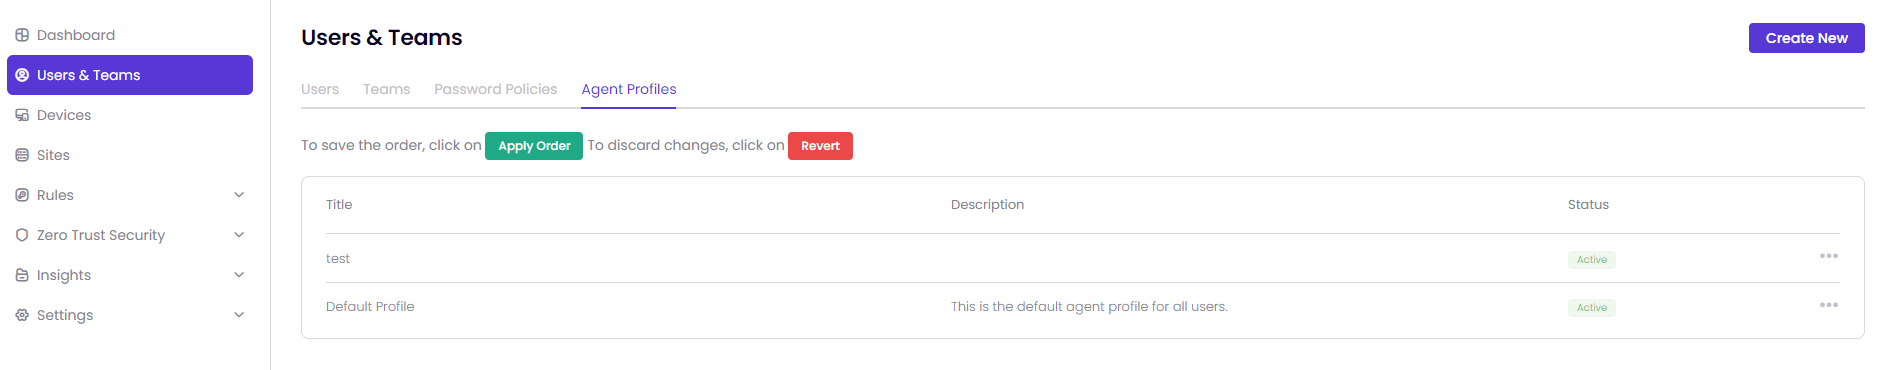
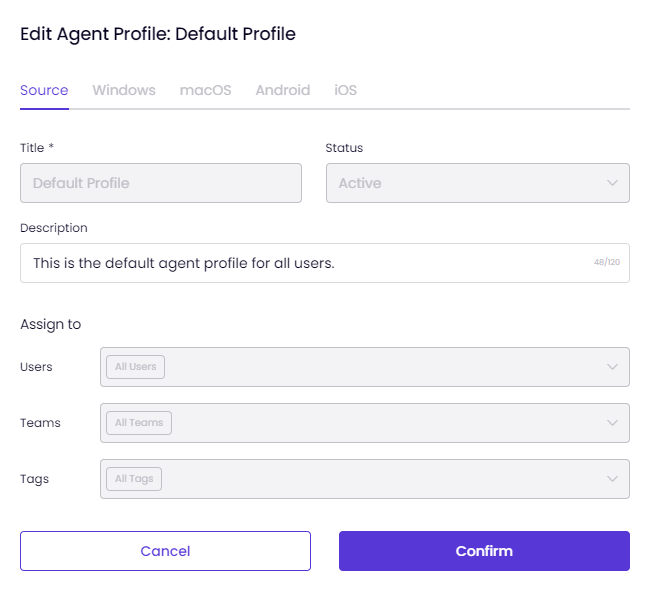
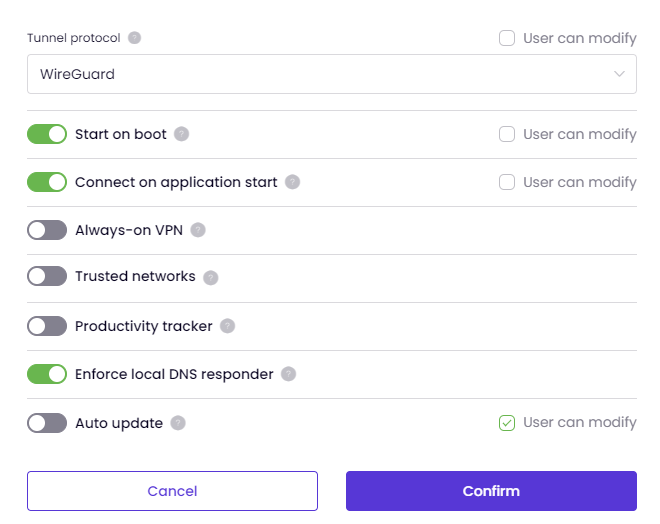
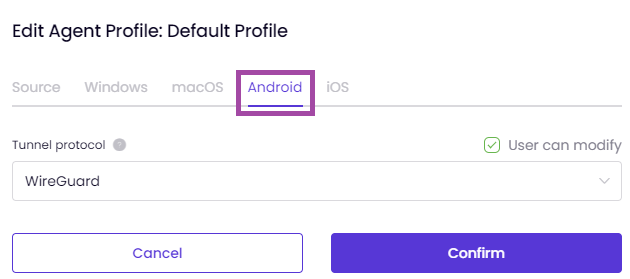
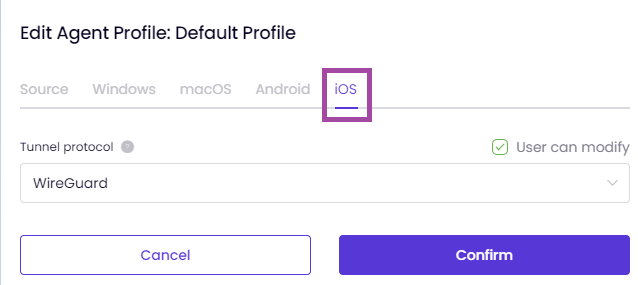
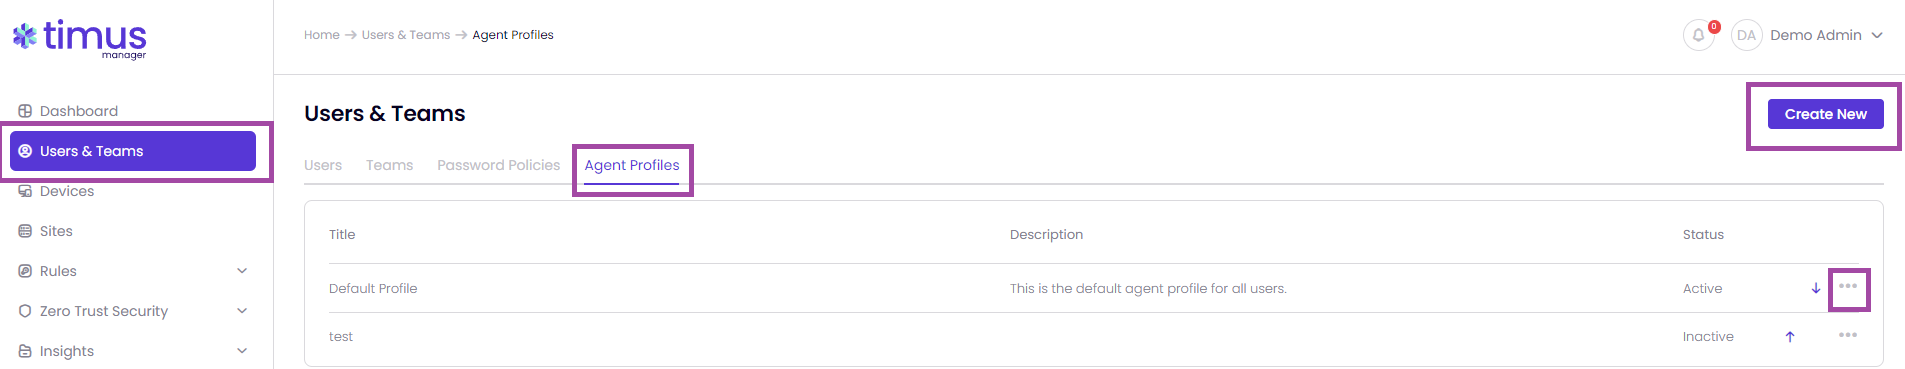
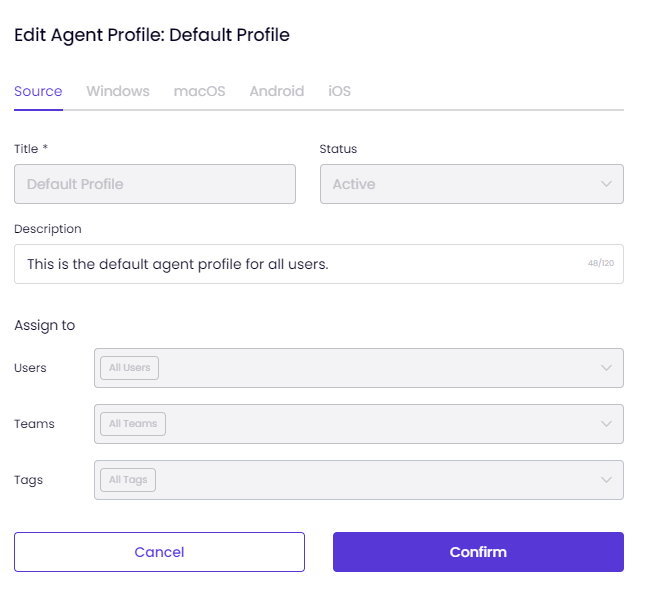
This article explains the process of creating and managing Agent Profiles on the Users & Teams page.
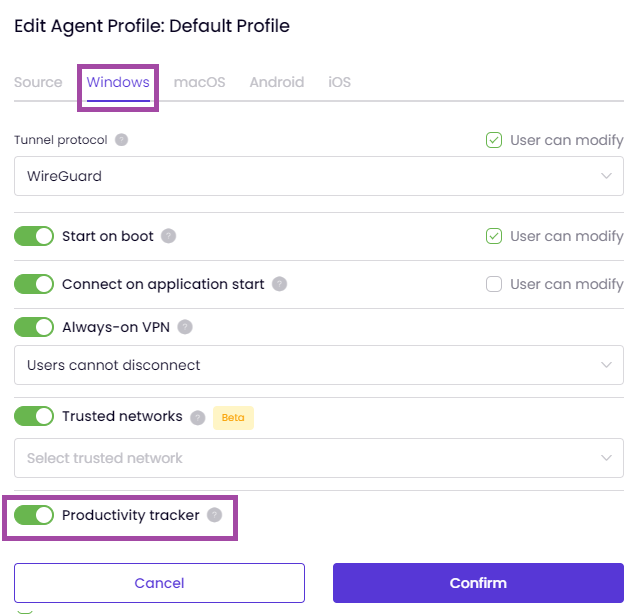
 Windows and MacOS:
Start on boot, Connect on application start, Always-on VPN, Trusted Networks and Productivity tracker options are only available on Windows and MacOS.
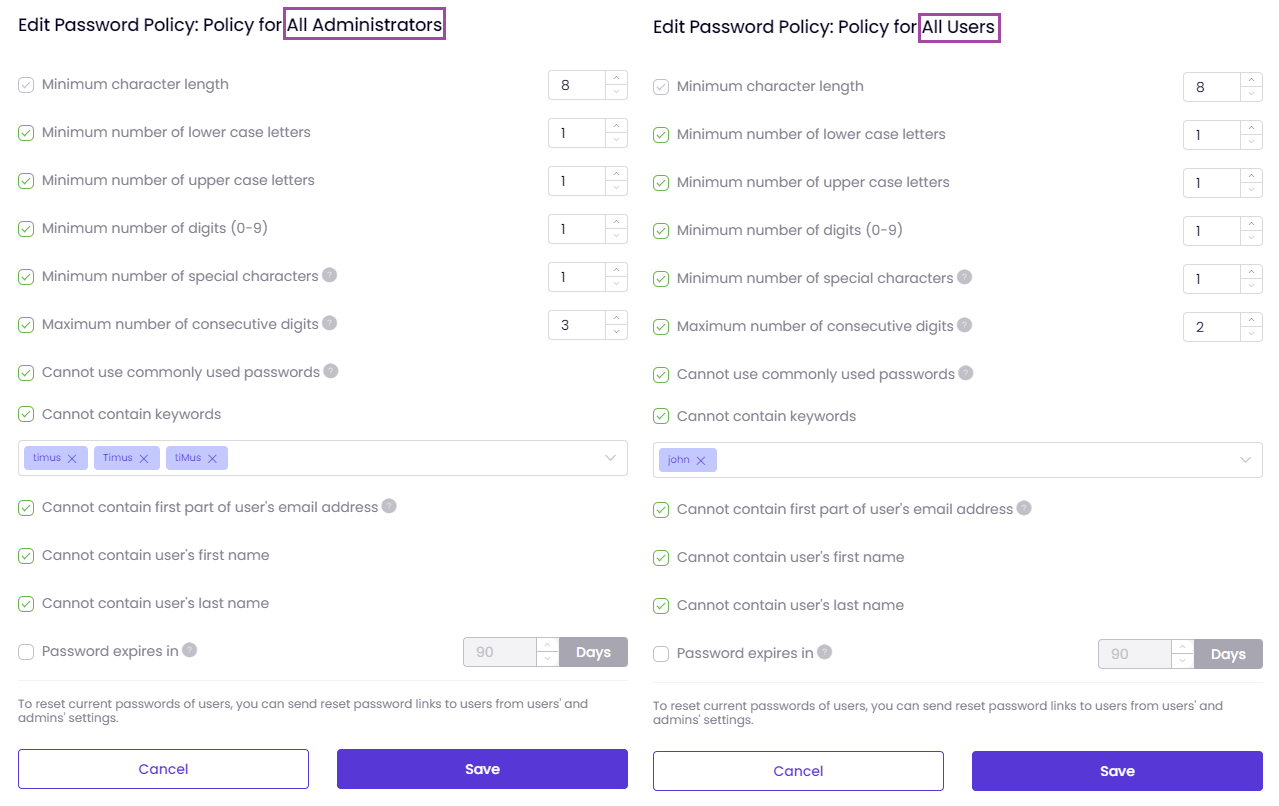
This article explains the process of managing Password Policies on the Users & Teams page.
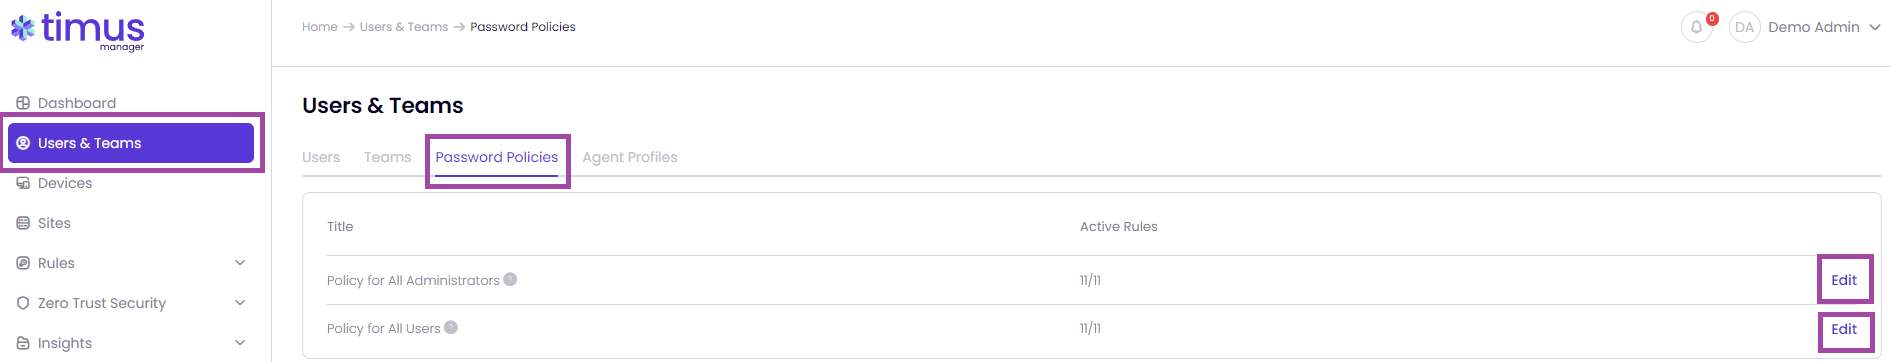
This password policy applies to all administrator accounts of the management portal.
This password policy applies to all user accounts that require a Timus password. Users that single sign-on with their third party Identity Provider accounts do not have Timus passwords, thus they are not bound by this policy.
We have 11 password policies. 6 of them are active and 5 of them are inactive in default as shown in the images below. You are able to change the password policies however you want
Once you click on Edit, you will be able to configure the policies however you want.
Minimum character length
This will be active all the time. You are able to change the minimum character length, which is 8 in default, to any numbers that you want.
Minimum number of lower case letters
We recommend using at least 1 lower-case letter to make the passwords stronger.
Minimum number of upper case letters
We recommend using at least 1 upper-case letter to make the passwords stronger.
Minimum number of digits (0-9) We recommend using at least 1 digit to make the password stronger.
Minimum number of special characters
If selected, password must include special characters such as !@#$-%&*+. We recommend using at least 1 special character to make the password stronger.
Maximum number of consecutive digits
For example; if 3 is selected, up to 3 consecutive digits such as 01, 012, 123, 456, 789 can be included in the password, 4 consecutive digits like 0123 cannot.
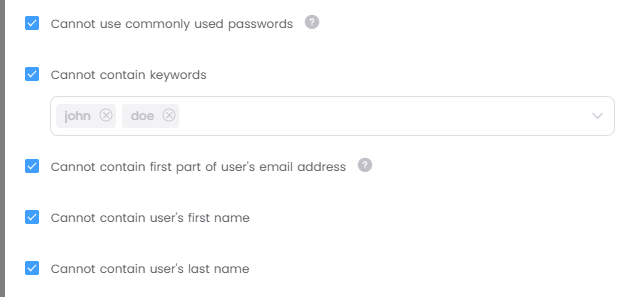
Cannot use commonly used passwords
Commonly used passwords can be very easily detected by automated tools of bad actors, thus using them leads to a vulnerability. This check is insensitive for upper-case and lower-case letters.
Cannot contain keywords
You can add the keywords, which you don't want the users/admins to use in their passwords, into here so that the users/admins are not able to use these keywords. Maximum 10 keywords can be entered.
Cannot contain first part of user's email address
For example, the password of the user with the email address johndoe@abc.com cannot contain the text 'johndoe'.
Cannot contain user's first name
If you activate this, the users/admins will not be able to use their user's first name in their passwords. This check is insensitive for upper-case and lower-case letters.
Cannot contain user's last name
If you activate this, the users/admins will not be able to use their user's last name in their passwords. This check is insensitive for upper-case and lower-case letters.
Password expires in
Entered value will be set as the administrator's password expiration limit. Minimum value is 1 day and maximum value is 10.000 days.
C:\Program Files\Timus Connect\resources\service\lib\active-win\active-win-windows.exe process. To ensure proper operation, verify that this executable is not obstructed by any Endpoint Protection Platforms (EPPs) or other security software. It is crucial to whitelist active-win.exe in your security configurations.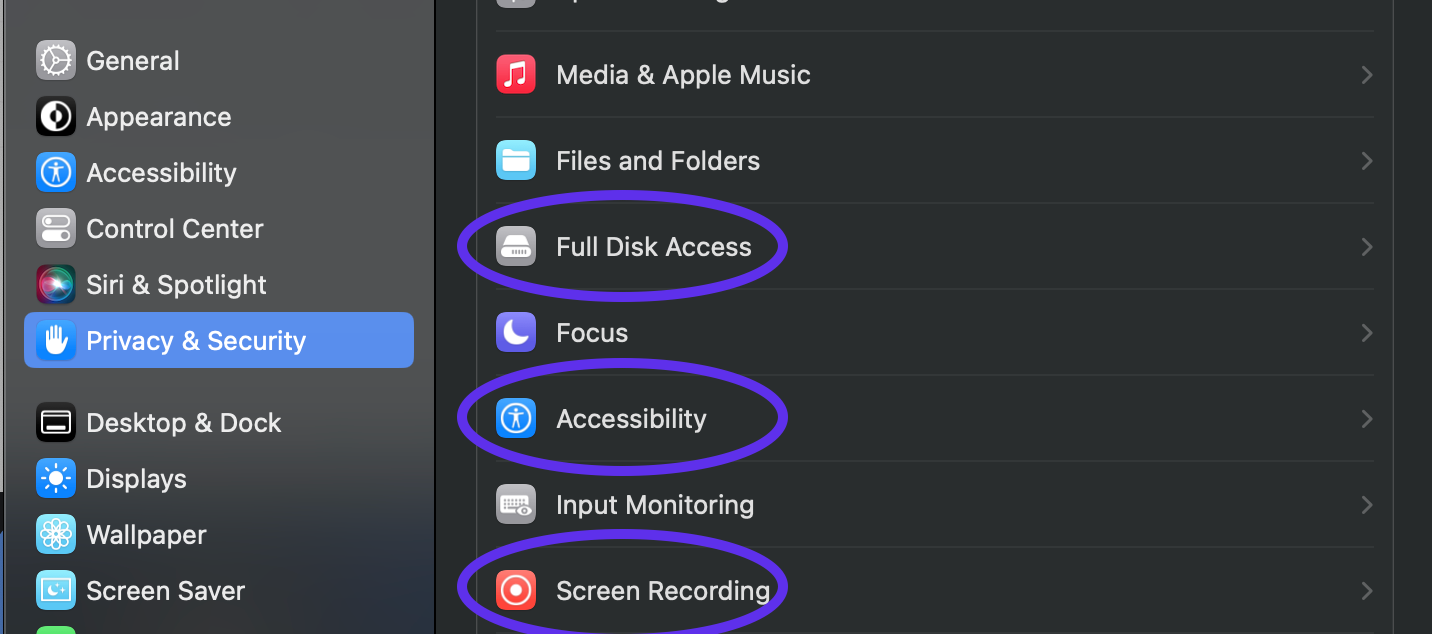
Always-on VPN will allow admins to control users' ability to disconnect VPN in Timus Connect app. 'Users cannot disconnect' means users cannot disconnect. 'Users can disconnect with admin approval' means users must submit a request to disconnect, and admin must approve the request. 'Users can disconnect without admin approval' means users must submit a request to disconnect, and request is automatically approved, without the need for admin approval. One request is valid for one disconnect only.
This feature is only available on Windows and MacOS.


This feature does not provide User can modify option. Therefore, if it is enabled by the admin, the users, selected by admin, will be tracered.

When you click on Disconnect on Timus Connect Application while you are connected to one of your gateways, you will see a pop-up as shown in the image below as long as Always-on VPN feature is selected as Users cannot disconnect.

Once Always-on VPN is selected as Users can disconnect with admin approval and you try to disconnect from the VPN, you will see a pop-up as shown in the image below. You will need to click on Go to My Timus page.

Once you click on Go to My Timus page, you will see the page as shown in the image below to send a request to your admin to be able to disconnect from the VPN.

Once you click on Create Request as shown in the image above, you will be able to see the pop-up screen as shown in the image below. The request will be selected as Disconnect VPN automatically, you need to write a reason why the admin should let you disconnect from the VPN.
The reason field is not required, you can leave it blank.

Once you save the pop-up screen above, you will be able to see your all requests on the main page my.timusnetworks.com located on the tab Requests if they have been approved or not.
If you have already sent a request to the admin to be able to disconnect from the VPN, you cannot send a new request until the admin responses your request.
You can cancel your request anytime that you want while the status is pending.
The selected admins by the super admin

Enabling notifications means that selected admins will get notification emails when a disconnect request is submitted, approved, denied, or cancelled. Emails will be sent for all requests, regardless of whether admin approval is required or not. Maximum 10 admins can be selected.
The status of Always-on VPN:
Pending: You have sent a request to the admin to let you disconnect from the VPN, you need to wait on your admin's response.
Approved: Your request has been approved by the admin. You are allowed to disconnect from the VPN if needed.
Denied: Your request has been denied by the admin. You are not allowed to disconnect from the VPN.
Cancelled: You have cancelled the request by yourself. It is no longer under consideration by the admin.

Once your request has been approved or denied, you will also be notified by an email as shown in the images below.
The deny reasons by the admins are as follows:


Heimdal Endpoint Protection Platform (EPP) is a comprehensive cybersecurity solution that provides advanced threat detection, prevention, and response capabilities. It integrates seamlessly with the Timus platform to collect, monitor, and analyze data from devices within your network, helping to enforce security policies and ensure a strong security posture.
Before you can integrate Heimdal EPP with Timus, you’ll need to gather the following details from your Heimdal Management console:
https://rc-dashboard.heimdalsecurity.com/api/heimdalapi).Once you have gathered all the necessary credentials and completed setup on the Heimdal side, follow the steps below to integrate Heimdal EPP with Timus:
Access Timus Manager:
Manage Heimdal Integration:
After completing the integration setup:
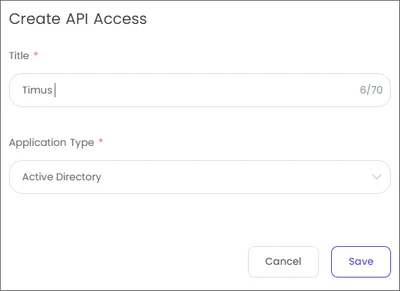
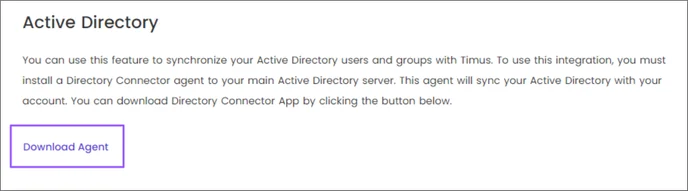
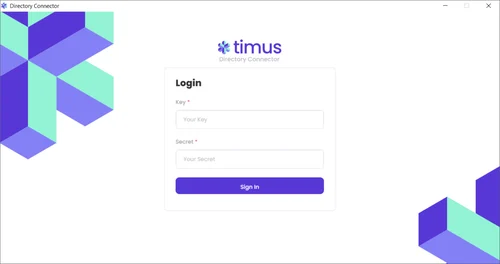
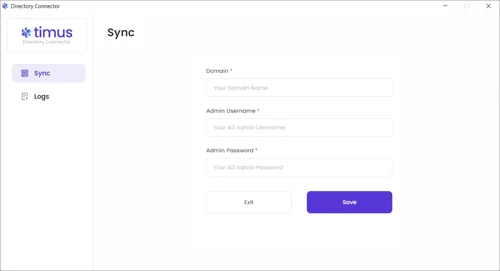
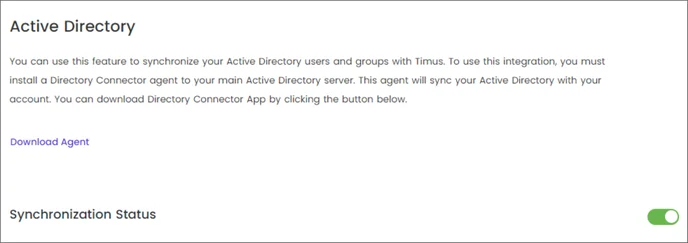
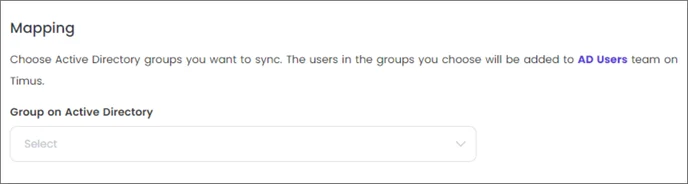
This article explains the process of synchronizing your Active Directory users and groups with Timus Manager
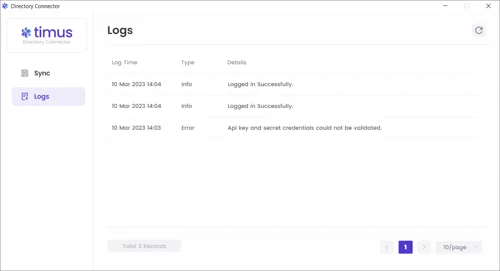
In the Logs tab, you can view all traffic on the agent under Log Time/ Type and Details parameters.
To integrate Bitdefender for using the getManagedEndpointDetails and getEndpointList API calls, you need to follow these steps:
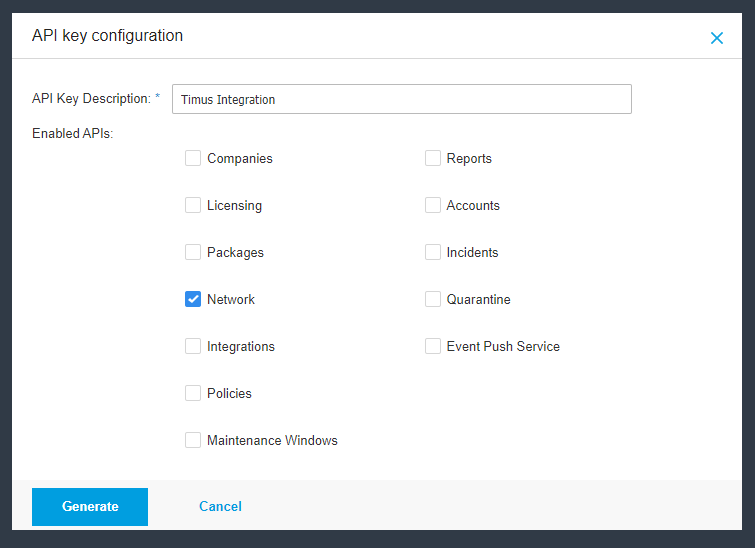
Step 1: Access the Bitdefender GravityZone Console
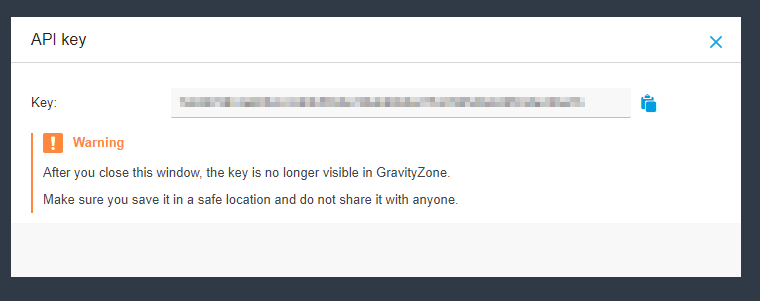
Step 2: Create an API Key
To use the getManagedEndpointDetails and getEndpointList API calls, ensure the API key has the following permissions:
Ensure your API key has the following permissions:
By following these steps, you should be able to integrate Bitdefender and use the getManagedEndpointDetails and getEndpointList API calls effectively.
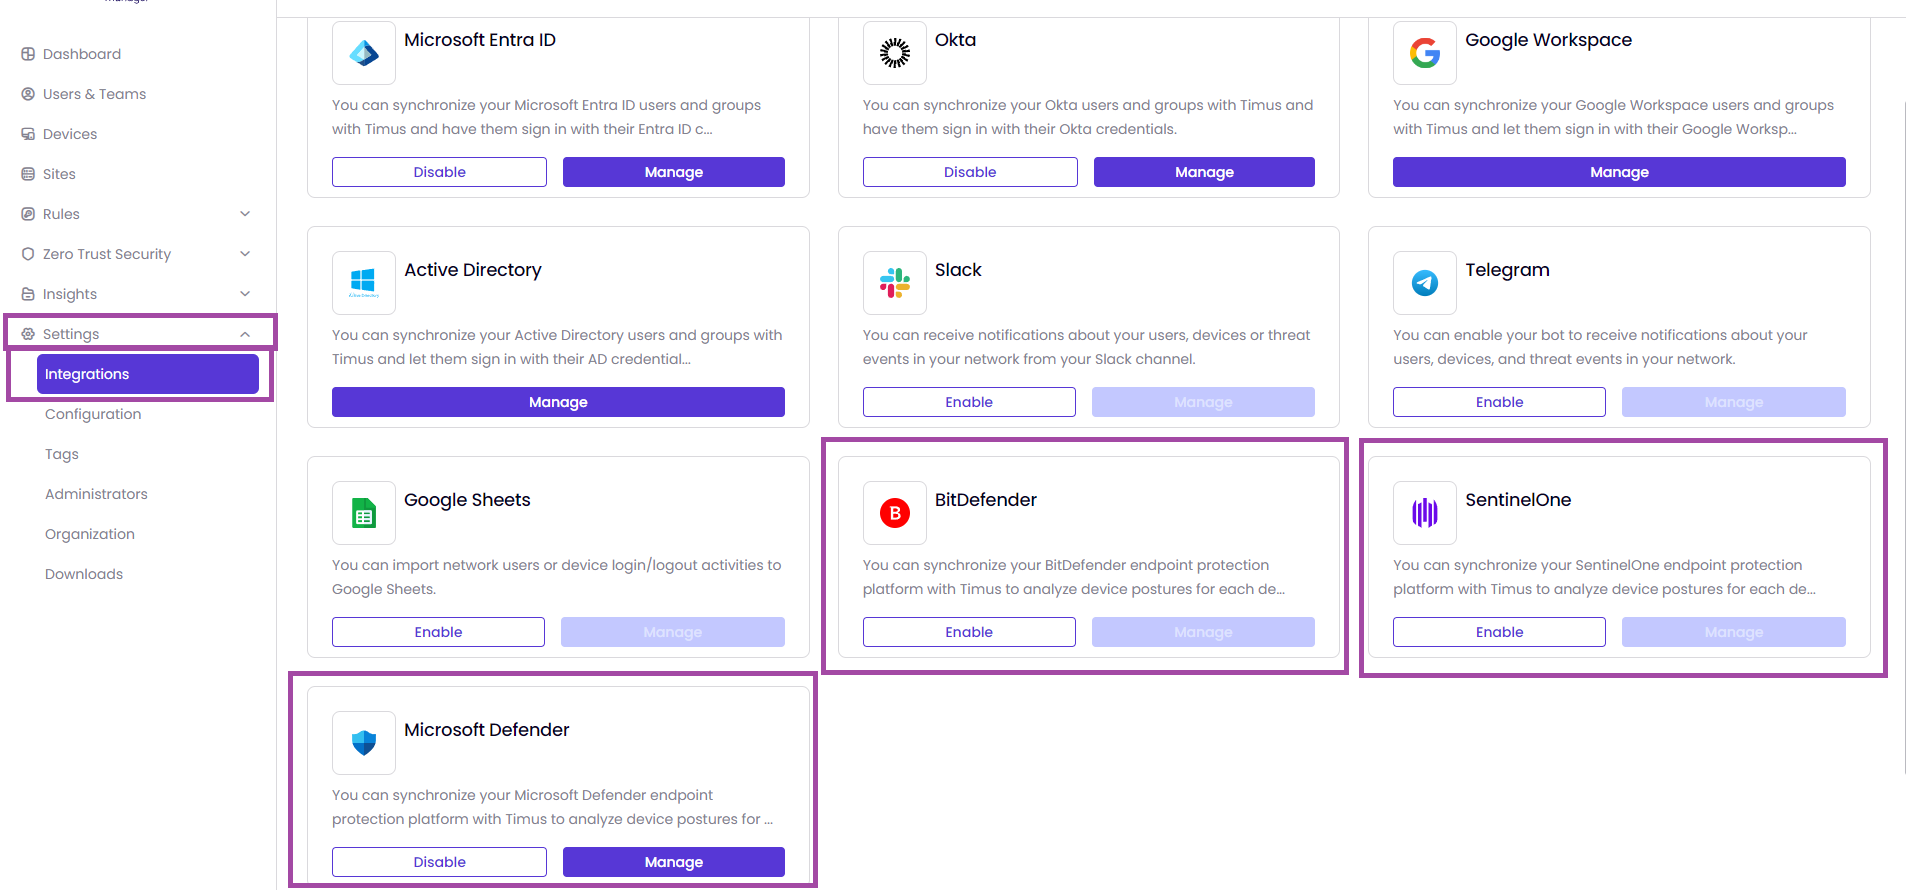
Now, you are ready to integrate with Timus. Please continue the article below to complete the integration. Device Posture Check and EPP
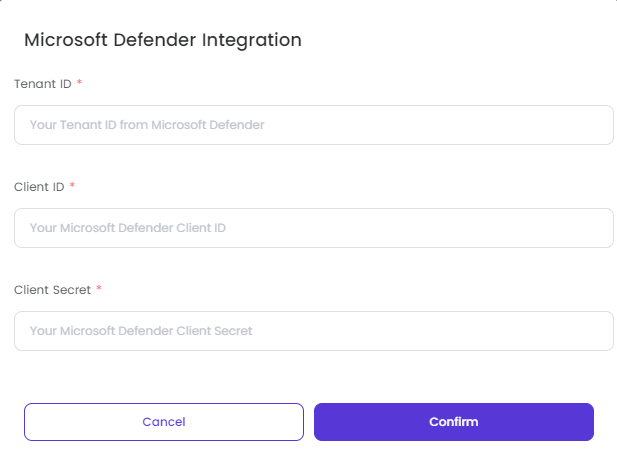
Microsoft Defender for Endpoint Integration Guide
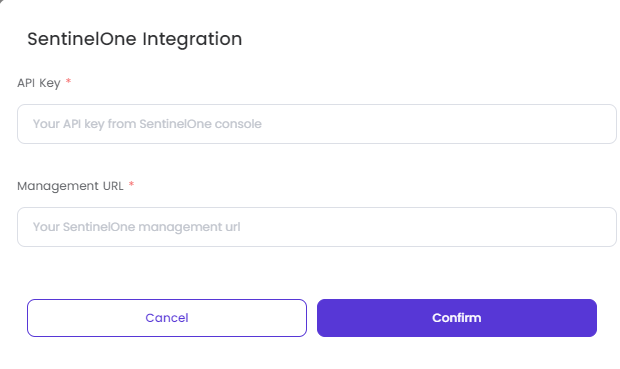
SentinelOne for Endpoint Integration Guide
Bitdefender for Endpoint Integration Guide

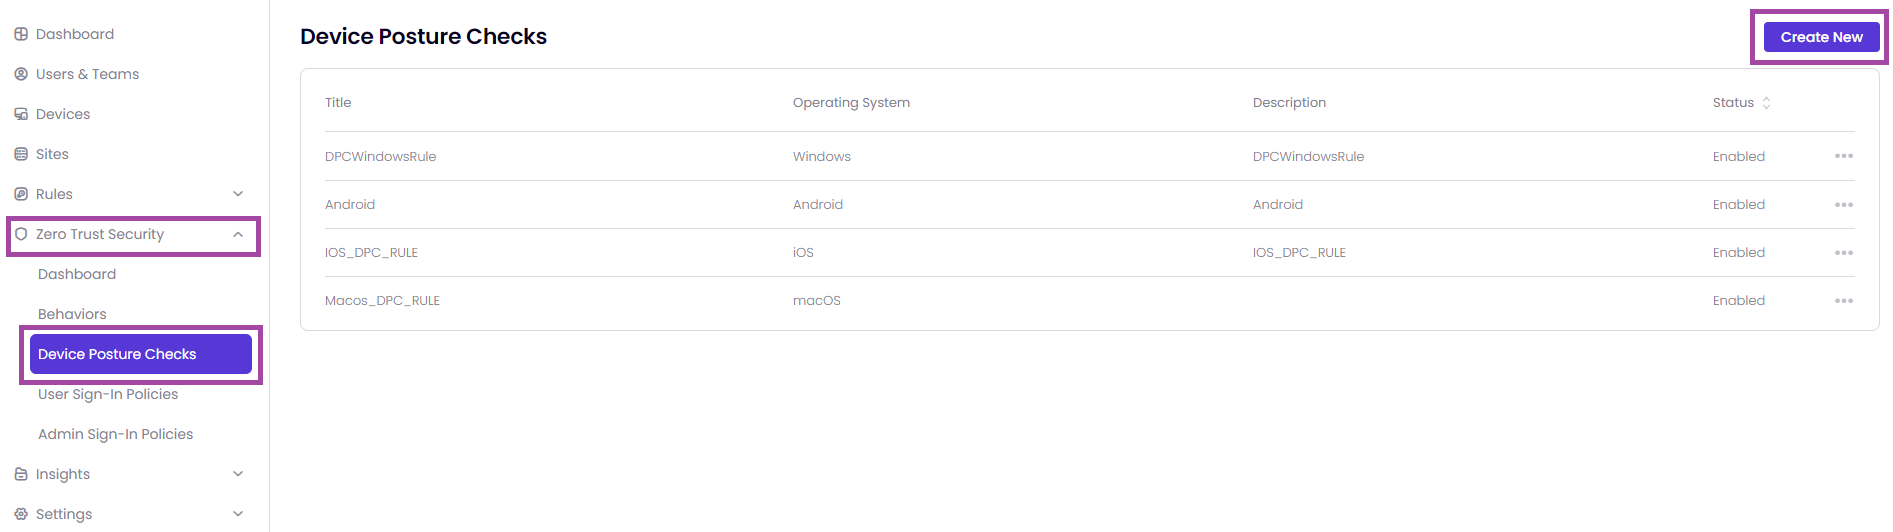
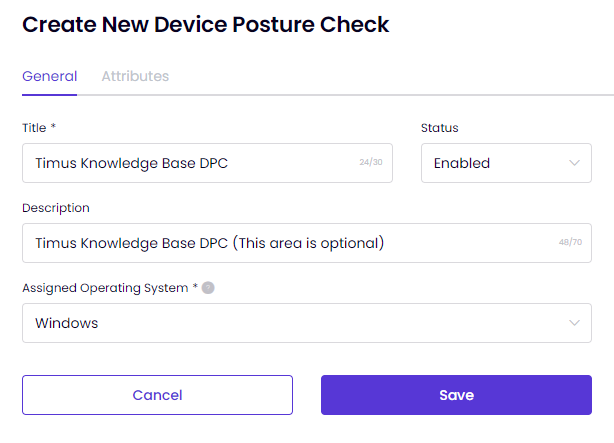
Select the operating system for which you wish to perform device posture check. Please note that only one posture check can be created for each operating system.
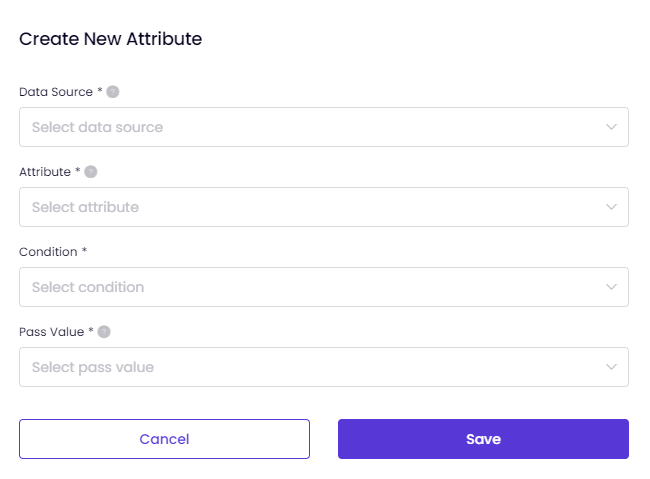
Select the source from which the attribute data is retrieved. This data source provides the information used to evaluate the device posture.
Choose the specific attribute that is gathered from the data source.
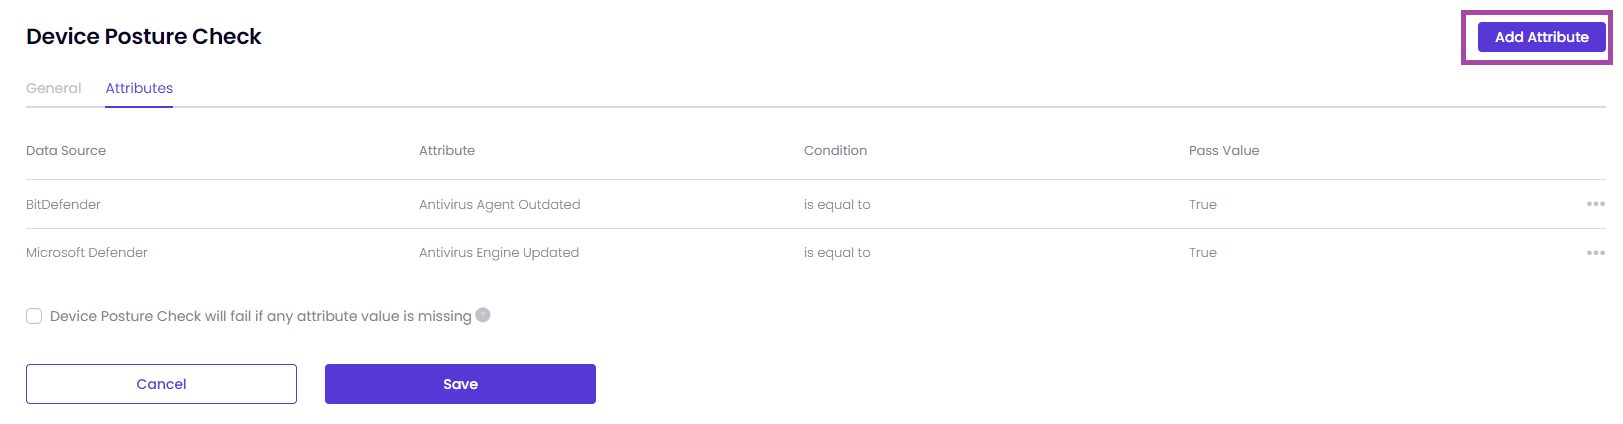
The Attributes if the Data Source has been selected as either BitDefender or Microsoft Defender.
The Attributes if the Data Source has been selected as SentinelOne.
Condition can be is any of or is equal to depending on the Attribute you have selected.
Pass Value: Define the expected value that the attribute must have to pass the check. It can two options, True and False.
After you define the Attribute successfully, you will see a pop-up as shown in the image below.
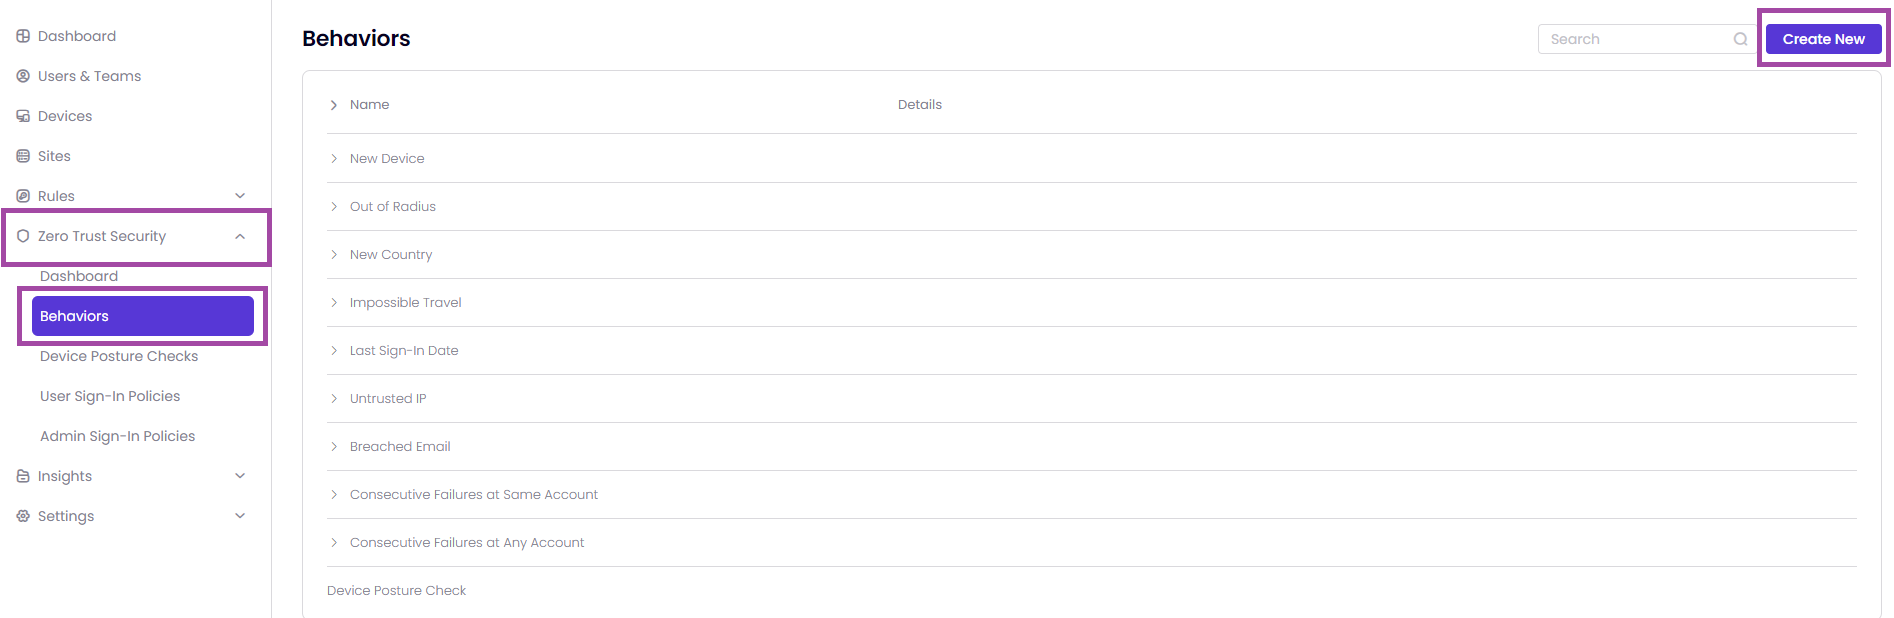
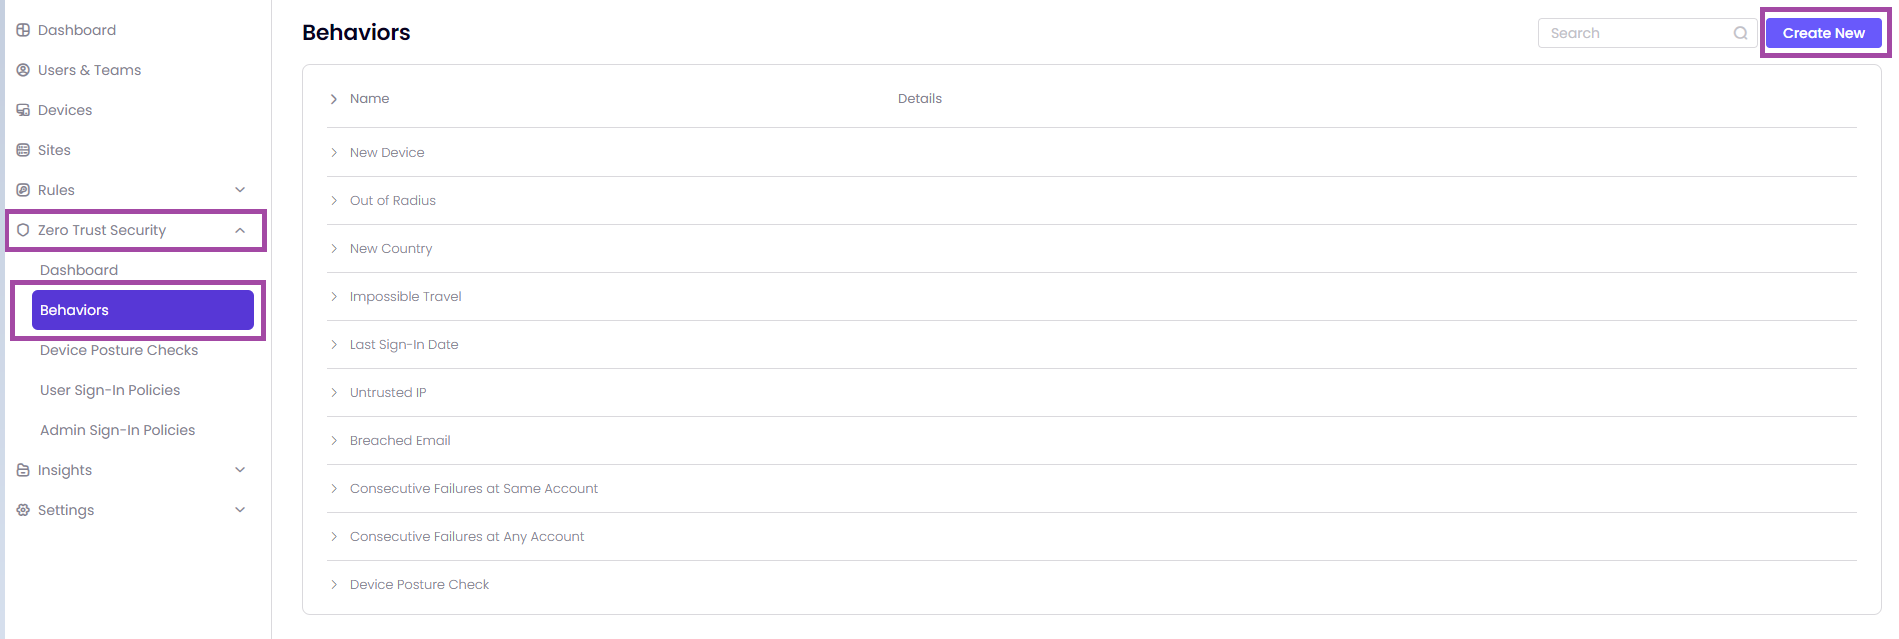
After completing the Device Posture Checks process, you can use ZTNA to apply some policies for the users. To be able to do it, you need to go to the page Zero Trust Security -> Behaviors -> Create New as shown in the image below.
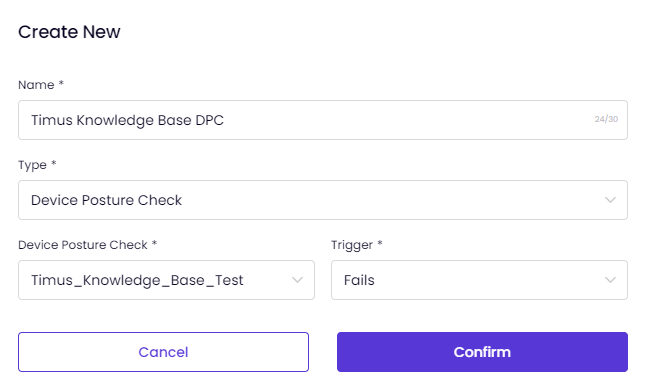
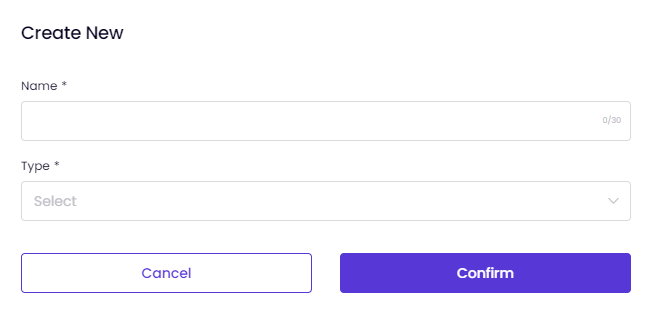
Once you click on Create New, you need to enter a Name and select Device Posture Check as a Type.
And, you need to select your Device Posture Check, which you have named it, and decide if the Trigger is Passes or Fails as shown in the image below.
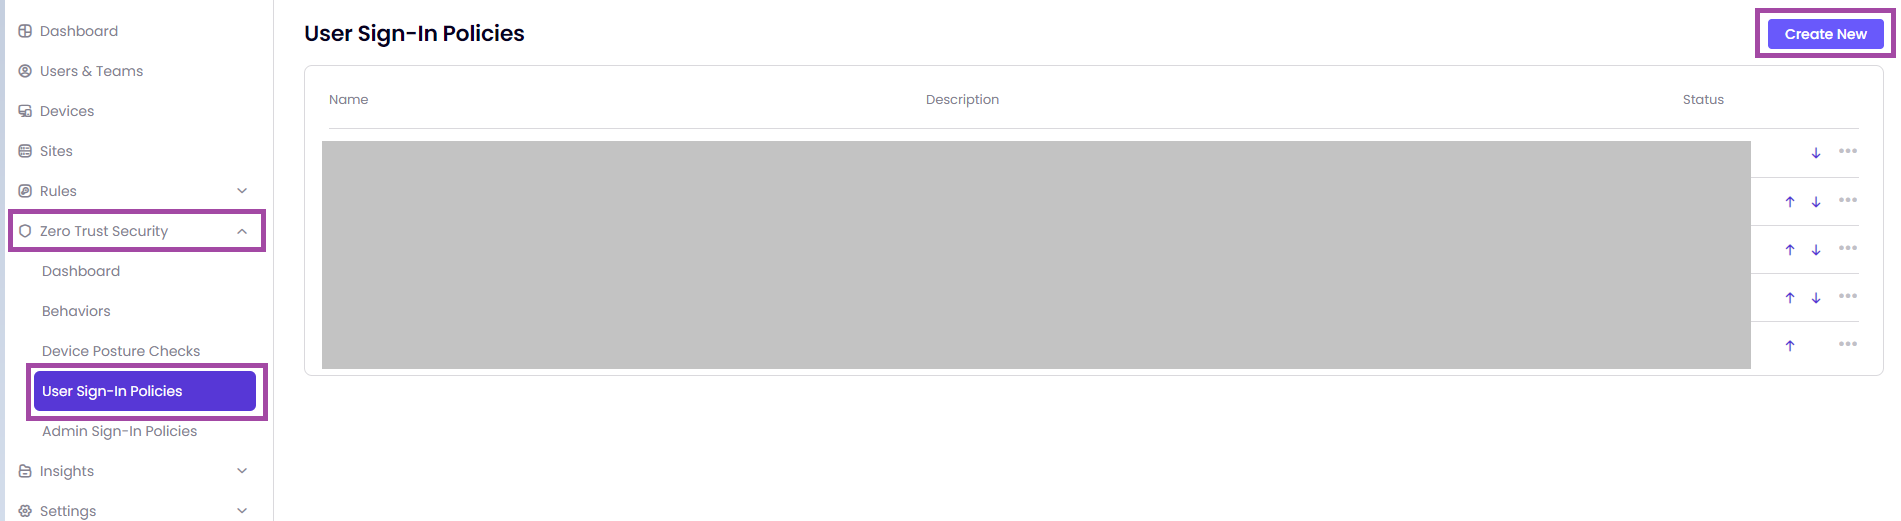
After creating the behavior, you need to go to the page Zero Trust Security -> User Sign-in Policies -> Create New as shown in the image below.
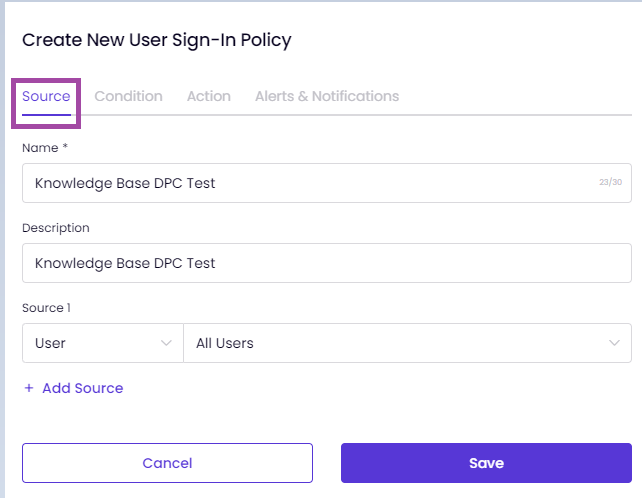
After clicking on Create New, you will be able to see the pop-up, which will allow you to define some ZTNA policies based on the behavior, which you have created, based on the Device Posture Check.
You can modify the example policy as shown in the image below according to your needs.
Here is an example ZTNA policy based on the Device Posture Check below.
If you would like to get more details regarding ZTNA policies in general, you can take a look at the article User Sign-In Policy.
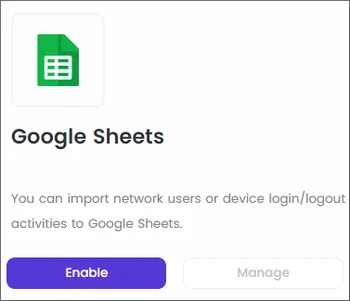
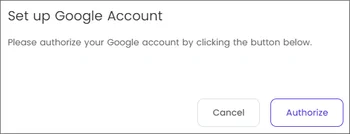
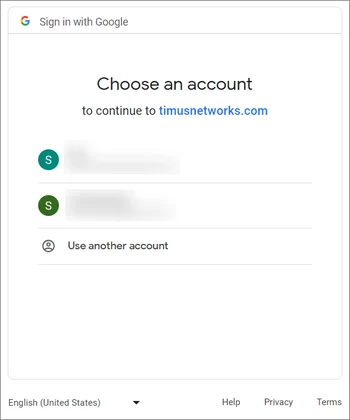
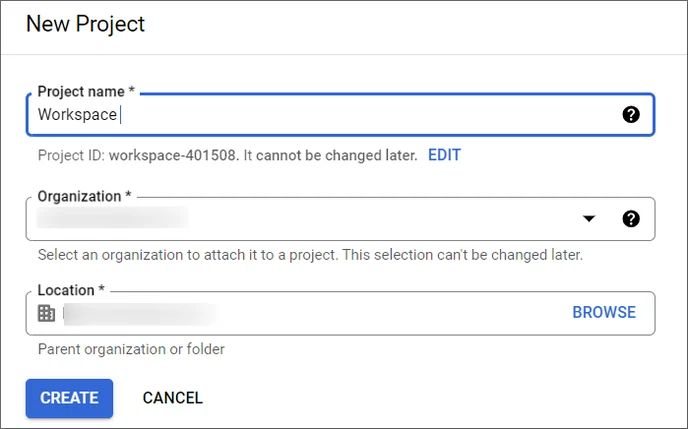
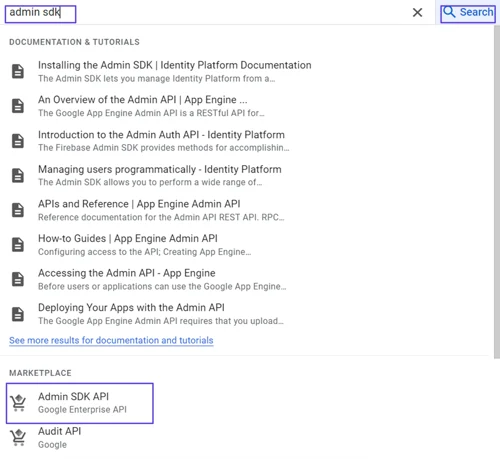
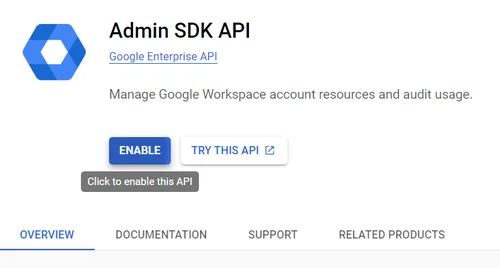
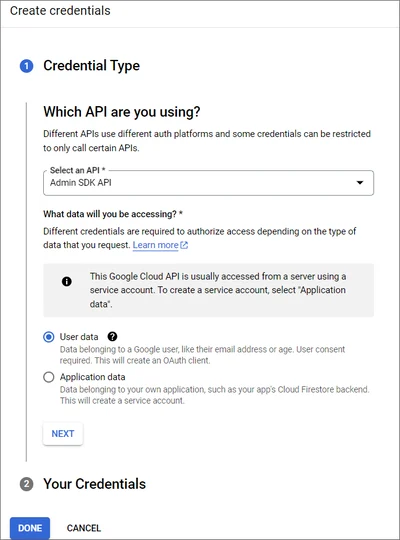
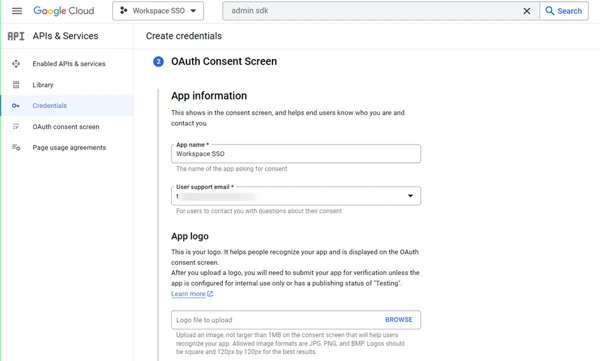
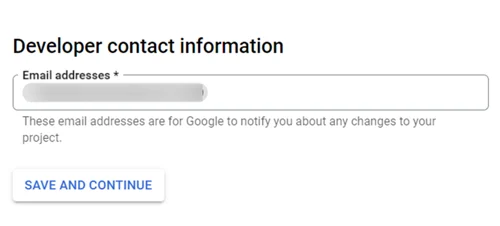
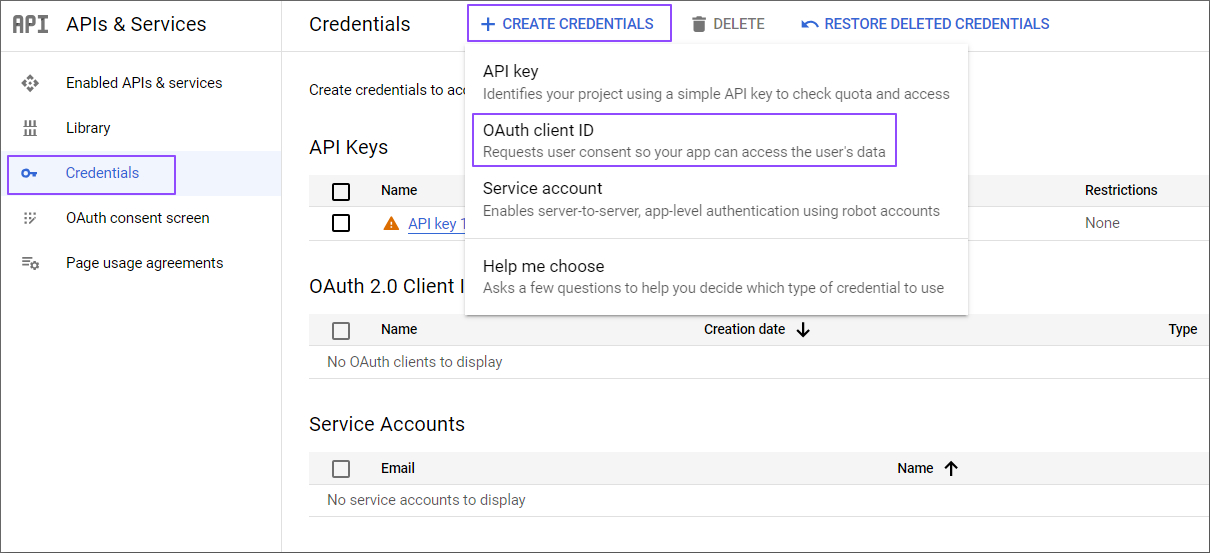
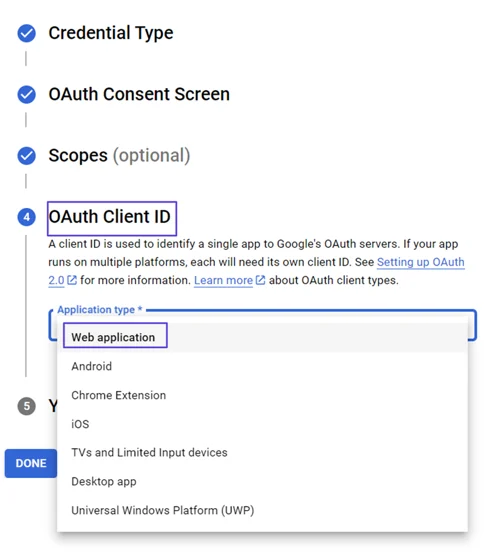
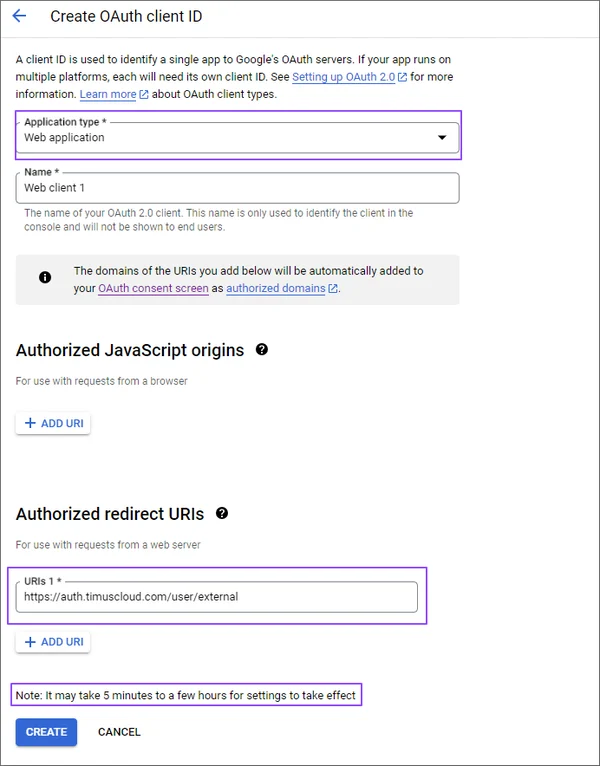
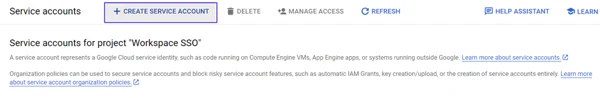
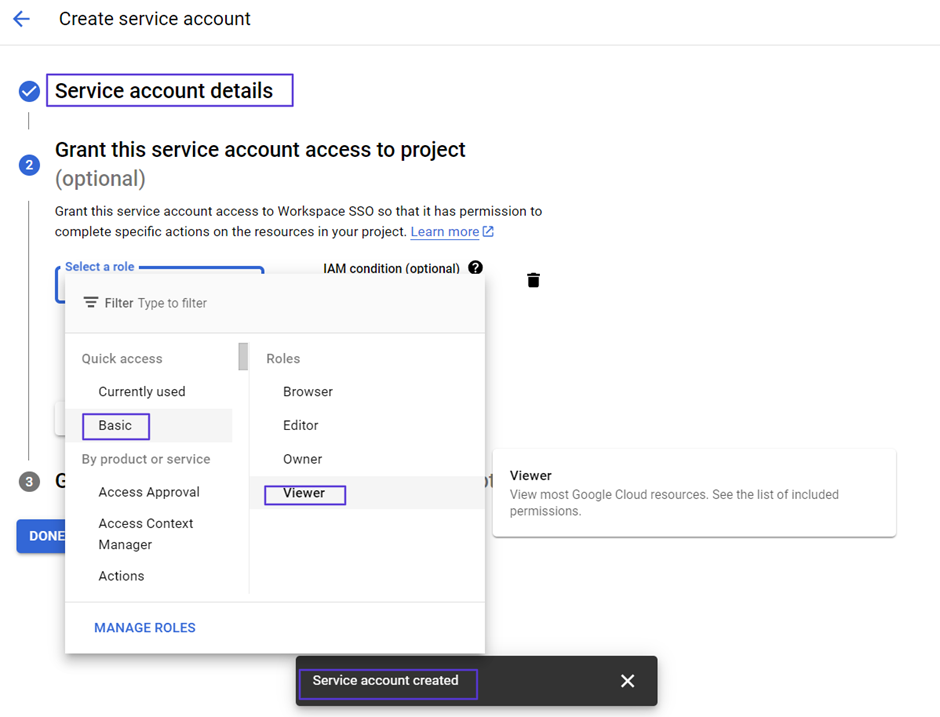
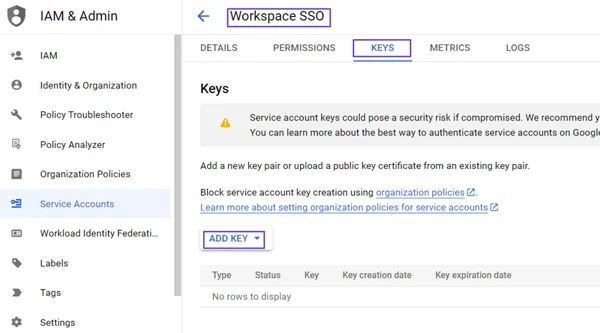
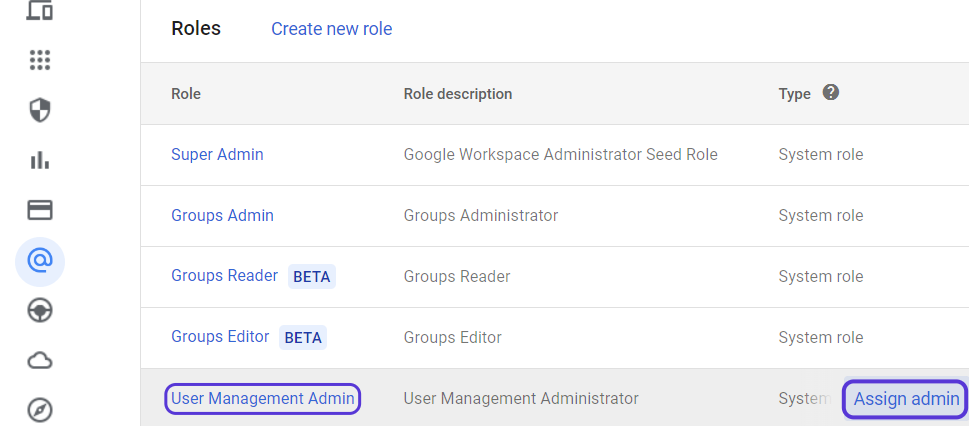
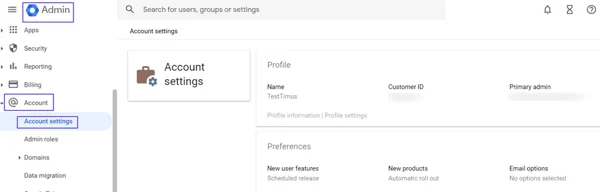
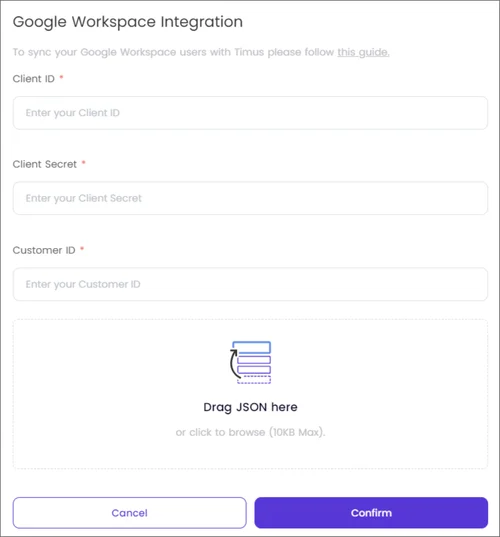
This article explains the process of enabling Google Sheets on Timus Manager.
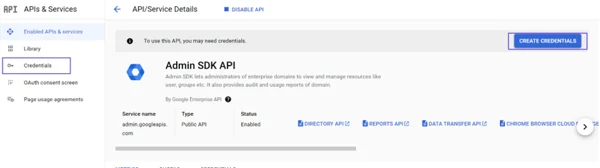

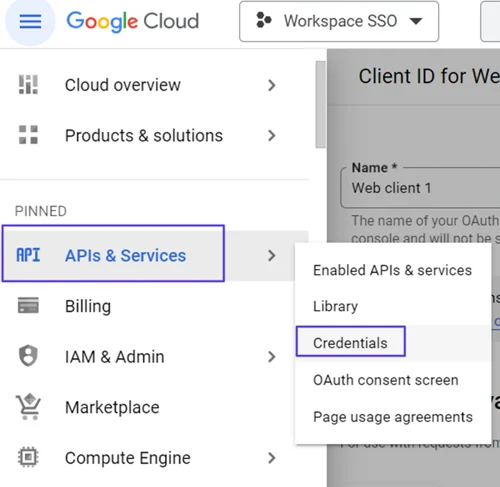
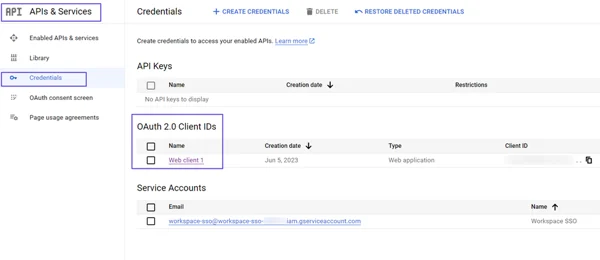
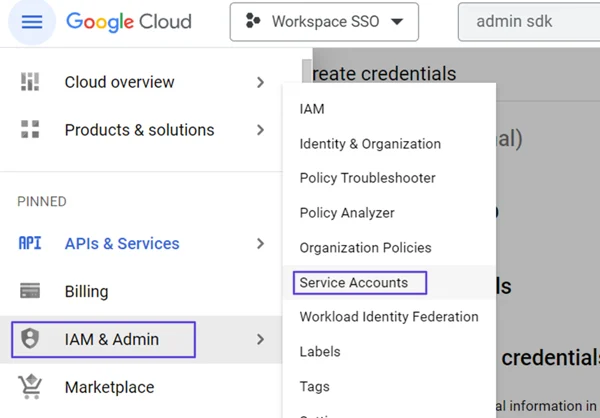
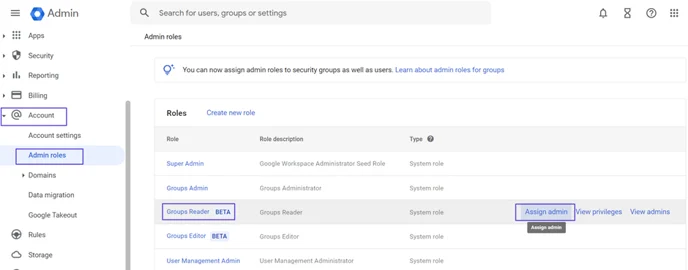
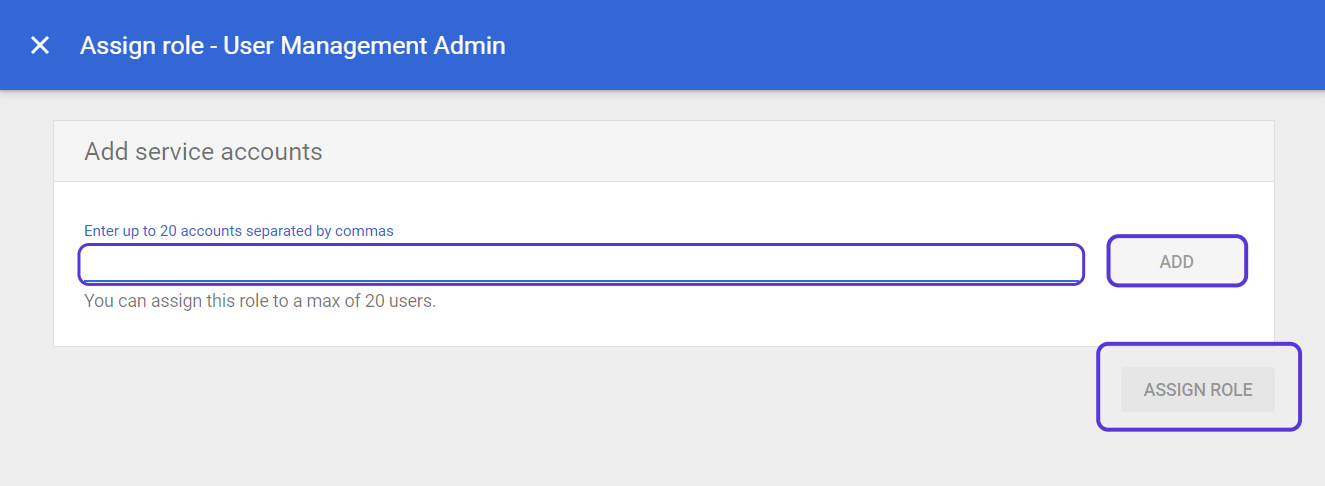
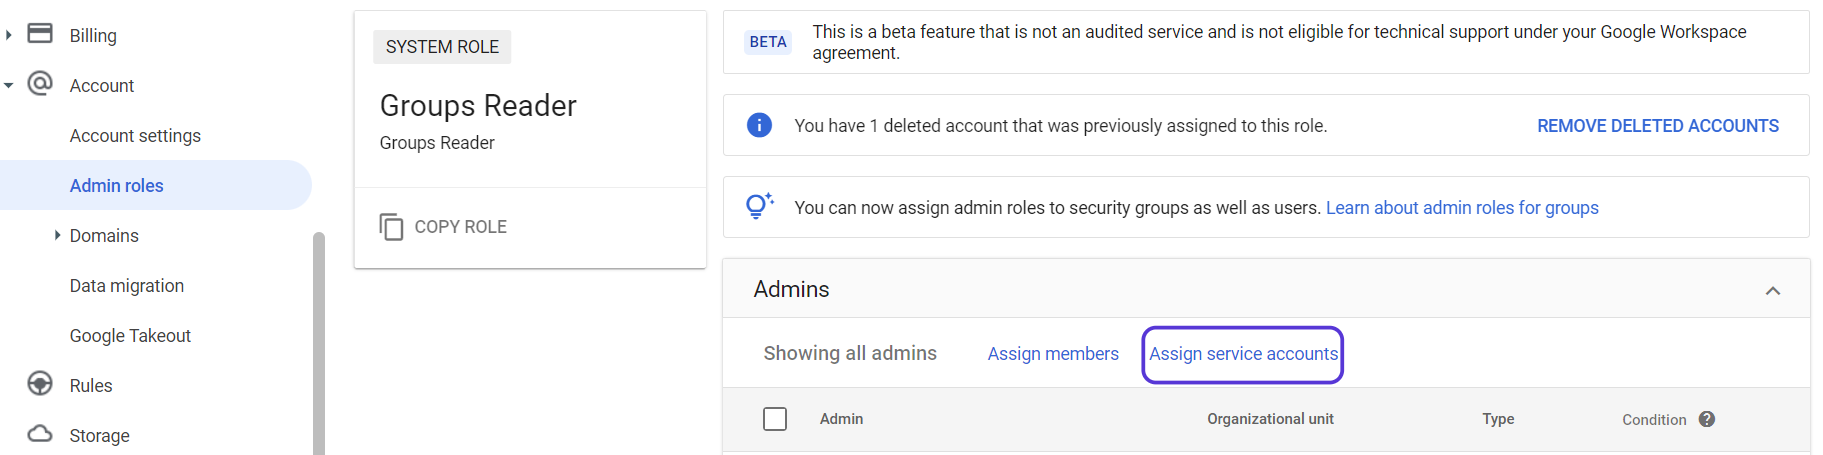 Click on Assign Service Accounts text on here.
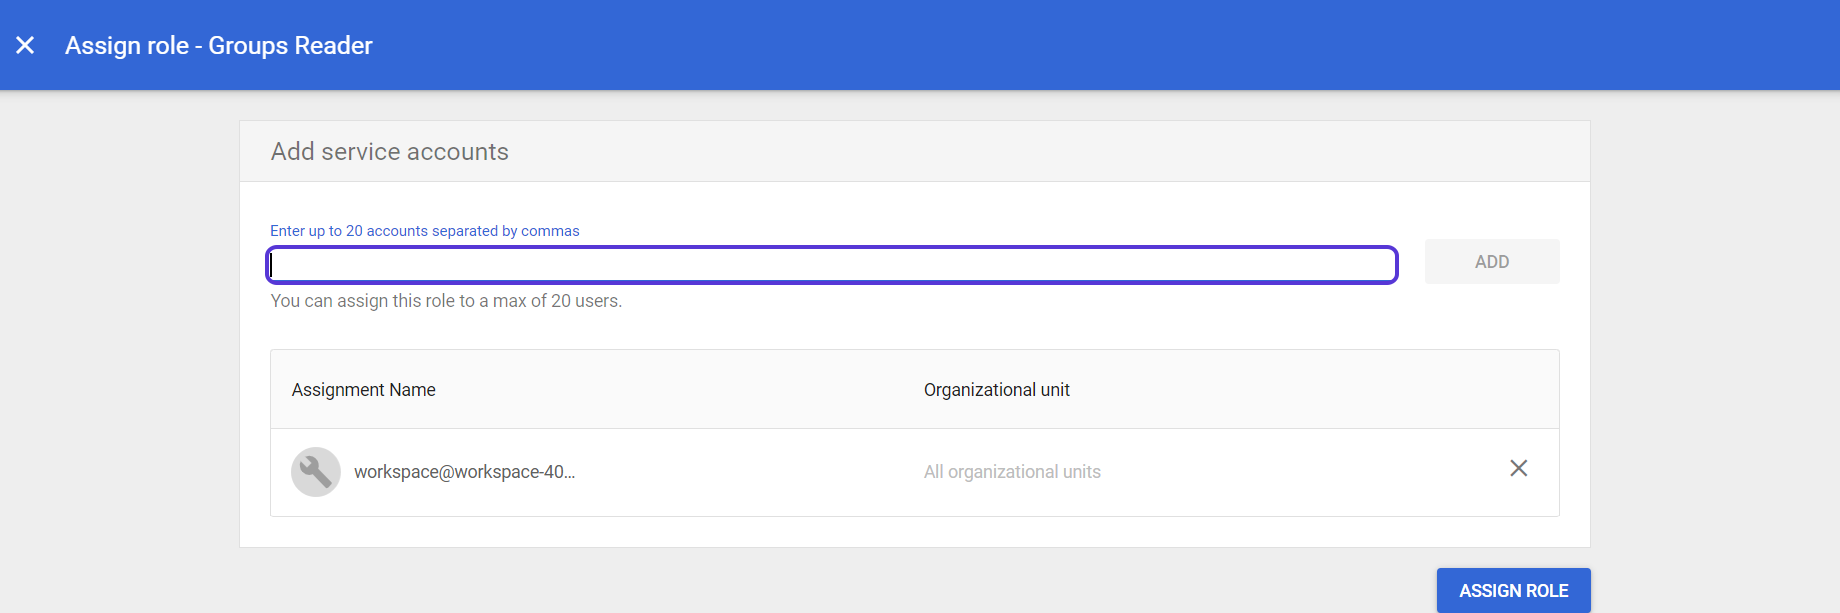
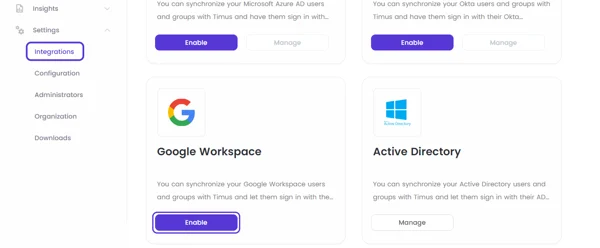 Click on Enable
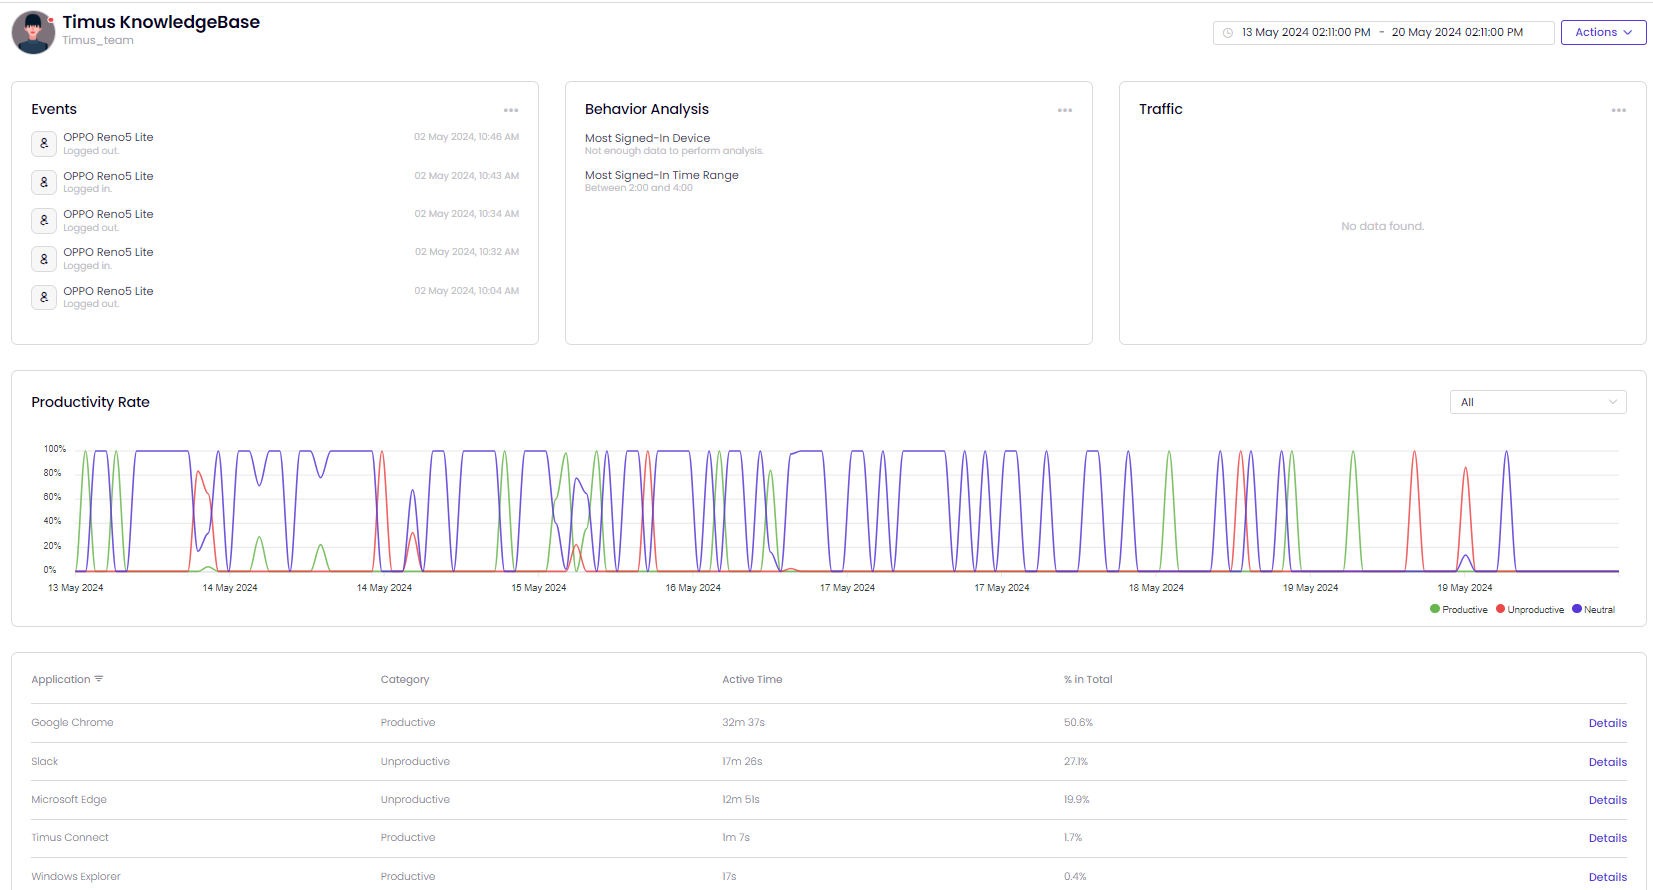
This article explains how to access data on the ZTNA Dashboard and enhance productivity and security by leveraging all available information in zero trust scenarios.
The Zero Trust Network Access (ZTNA) Dashboard provides a complete overview of all user and admin events within your network, all displayed on one page.
To filter the data displayed in widgets, start by using the User & Admin Events filter and the time filter located in the upper-right corner of the ZTNA Dashboard.
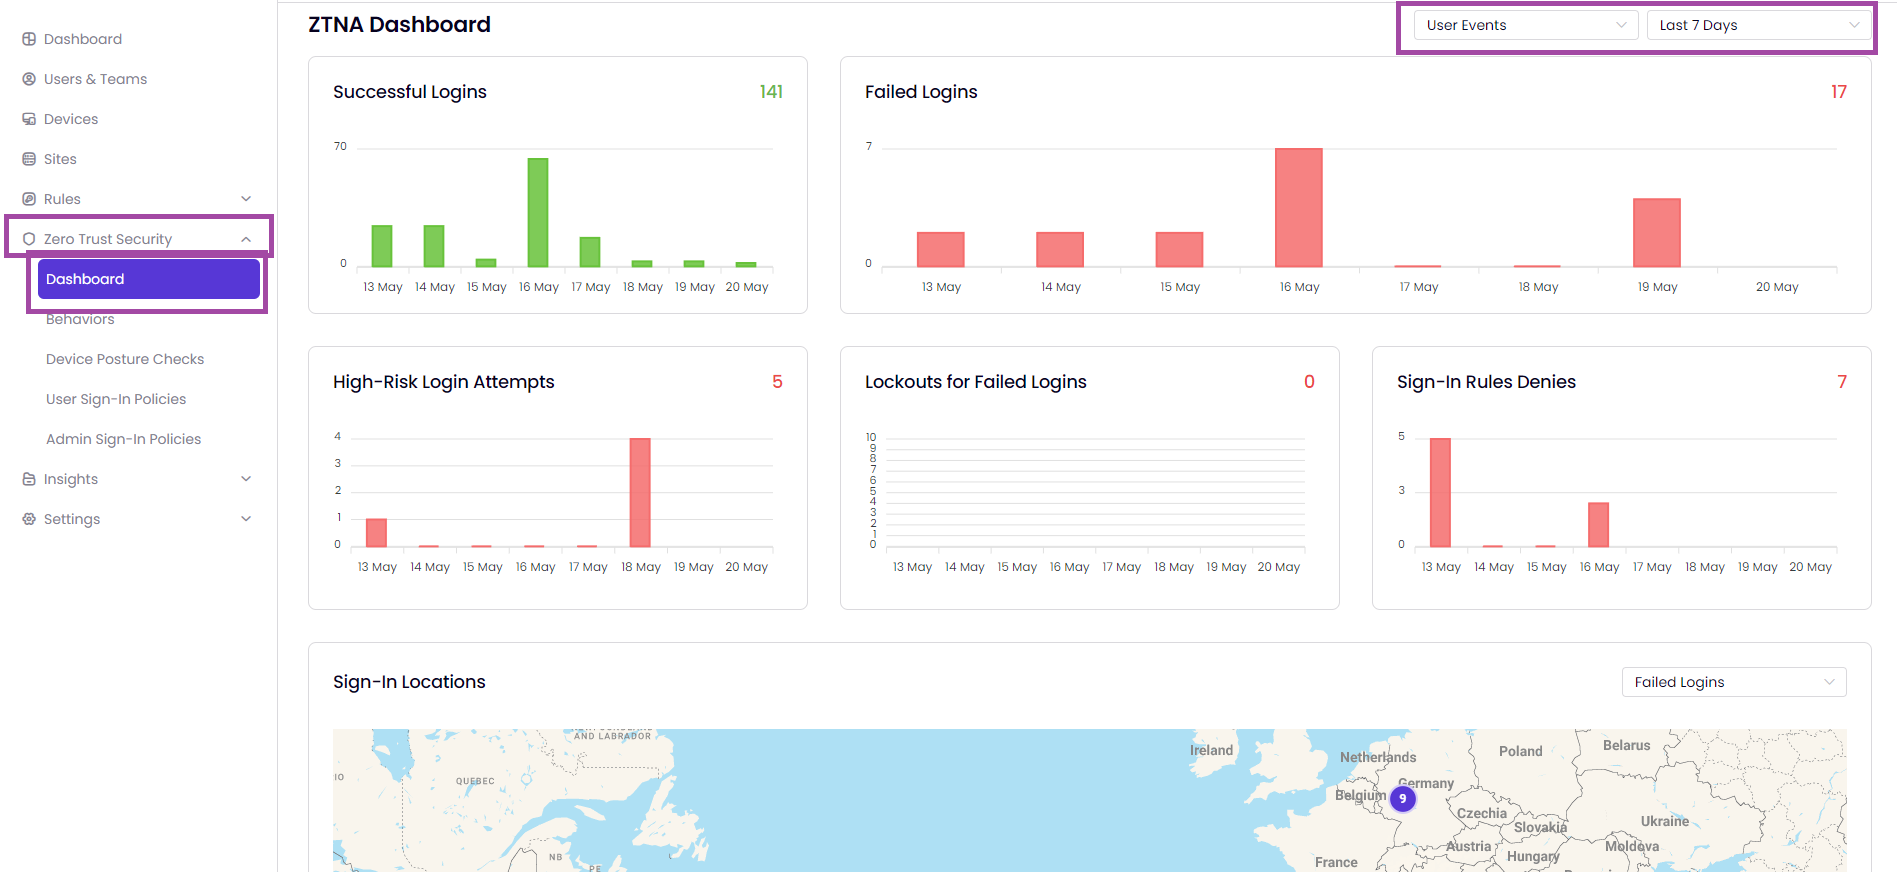
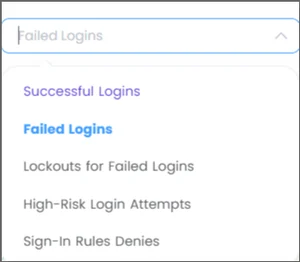
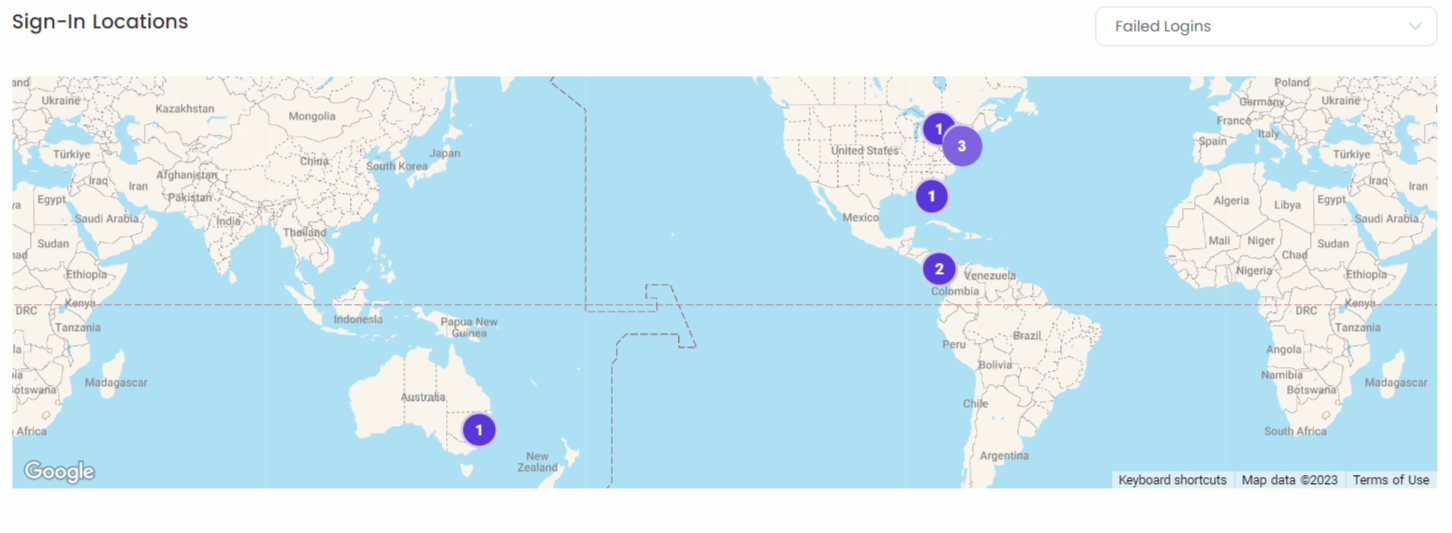
Access the information on successful logins, failed logins, high-risk login attempts, lockouts for failed logins, sign-in rule denies, and sign-in locations on graph and a map.
This article will guide administrators on how to create behavior-based, user sign-in policies Timus ZTNA.
Timus ZTNA offers a unique and improved access control method that allows businesses to expand without compromising the fundamental security of their network, which includes infrastructure, applications, data, users, and devices.
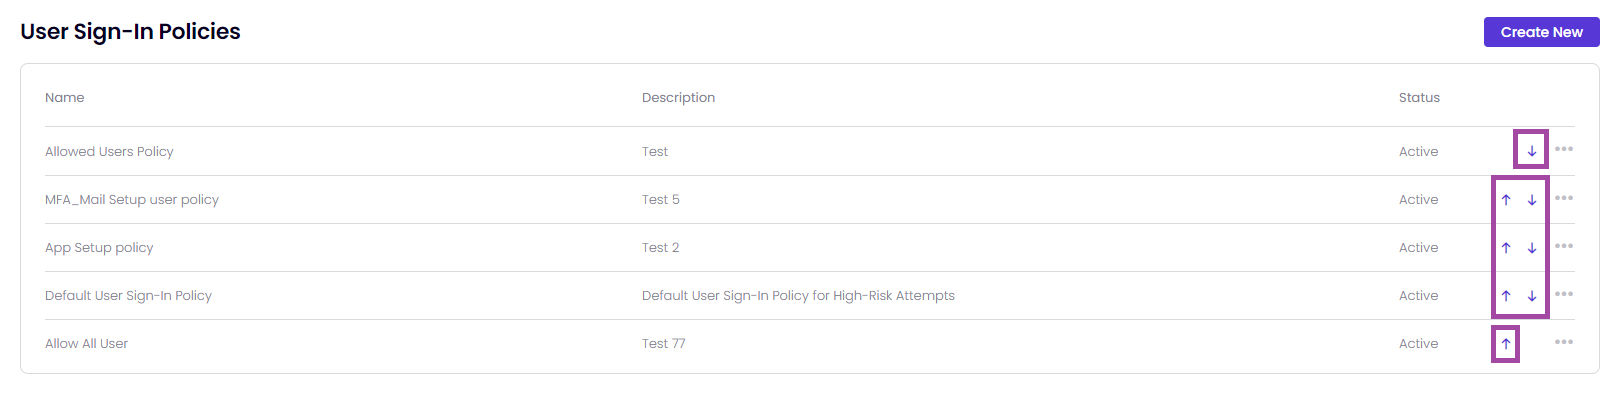
The policies within Timus' Zero Trust Network Access (ZTNA) security framework are organized and prioritized by its place in the policy table. A policy, which is placed higher in the table, is more prioritized than the other User Sign-In policies.

You can Deactivate the default user sign-in policy.
To create a new User Sign-In/Login Policy, follow these steps:
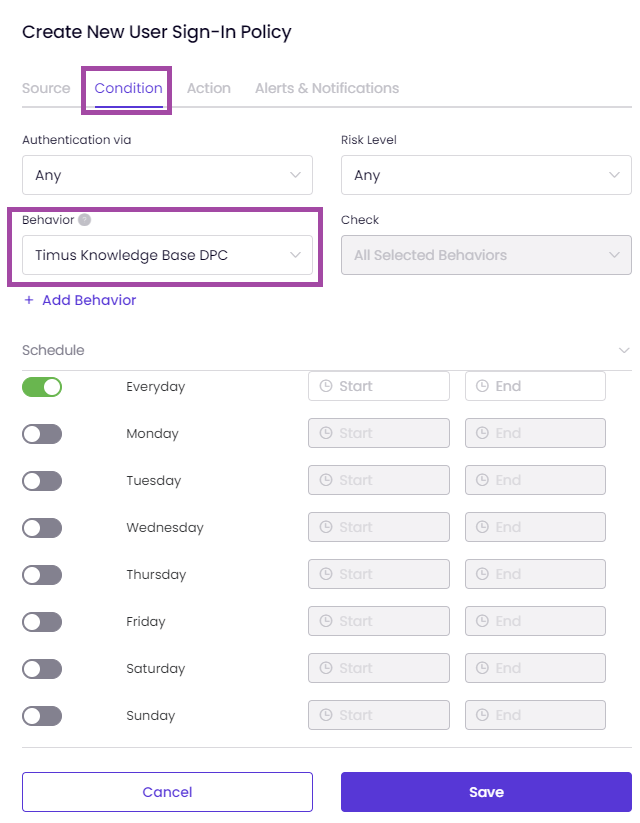
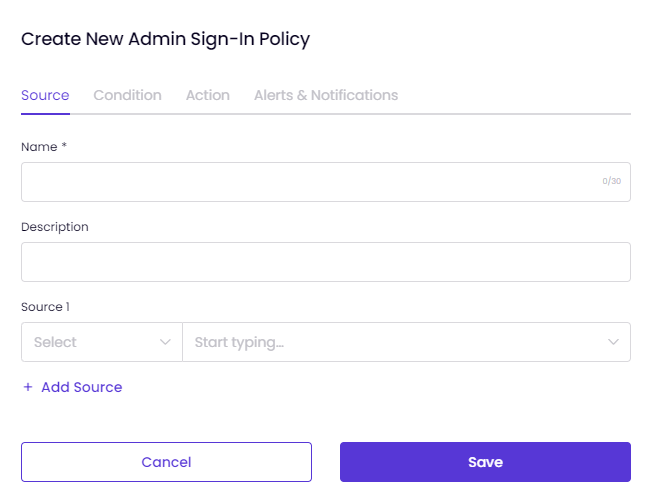
A pop-up window will appear with the following tabs:
On the Source tab:
If necessary, you can select multiple sources to apply to the policy.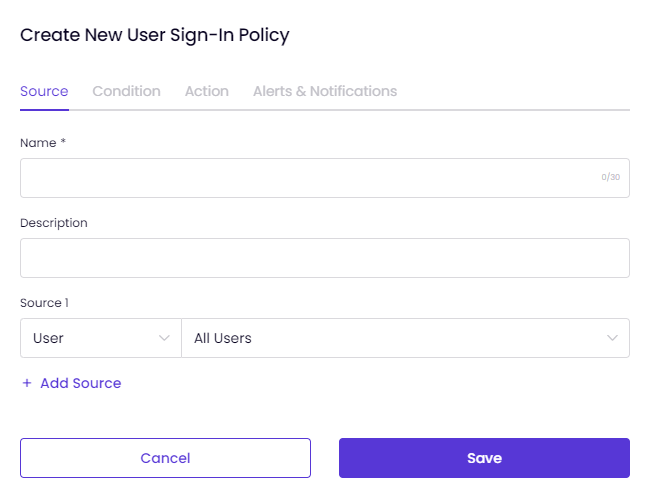
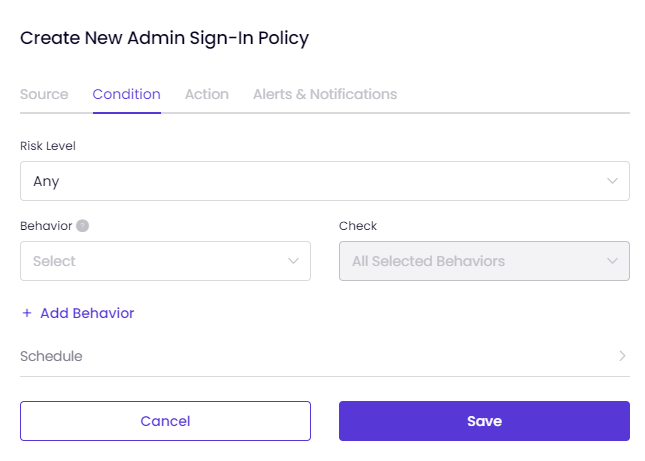
On the Condition tab,
Schedule the policy.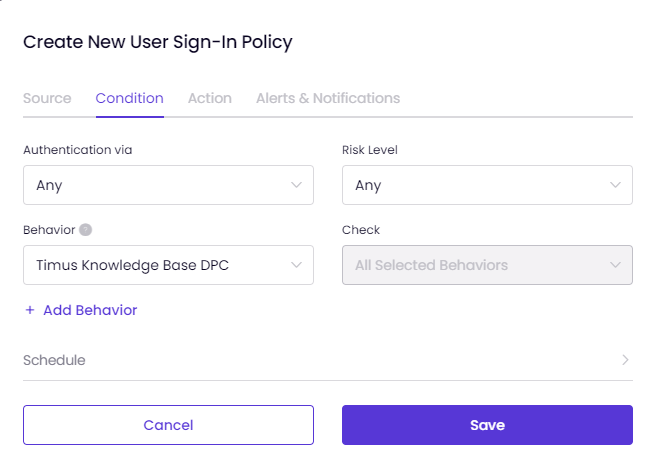
When "All Selected Behaviors" is chosen, all selected behaviors such as Untrusted IPs, New Device, and Breached E-mail Address must be active simultaneously for the policy to take action.
When "Any Selected Behavior" is chosen, at least one of the selected behaviors must be triggered by the policy to take the action.
You can consider All Selected Behaviors like "AND &&" and Any Selected Behaviors like "OR ||" as in coding language.
Experience the user-friendly interface of Timus by hovering over the info icons on the policy creation screen:
When you add a behavior to the policy with the add behavior button on the screen and hover over that behavior, you can view the brief explanation about the behavior you added:
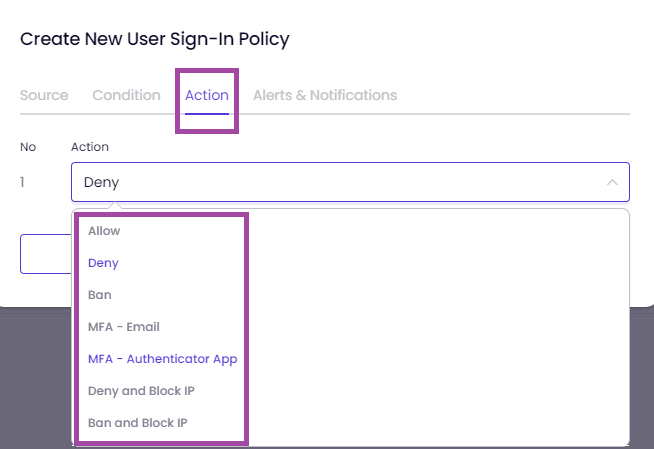
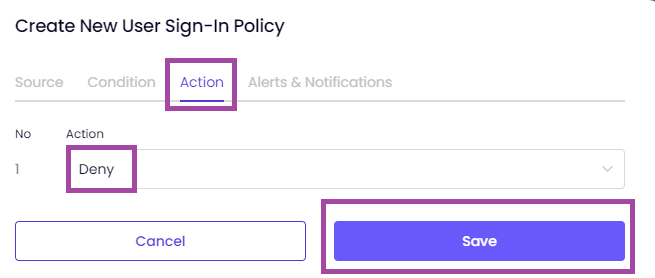
On the "Action" tab,
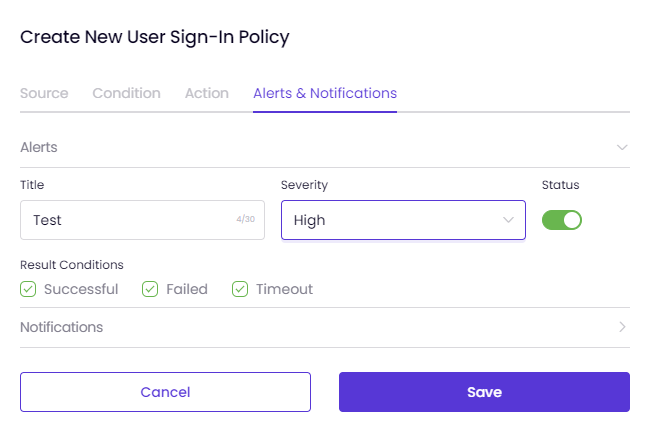
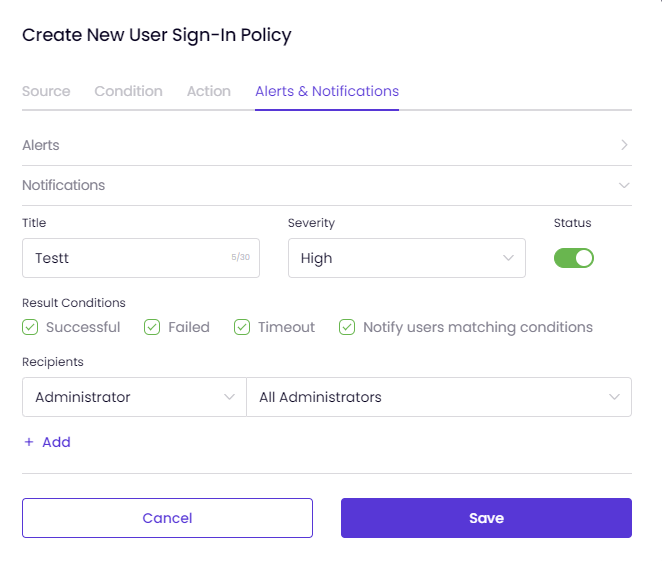
Select an action from the drop-down list.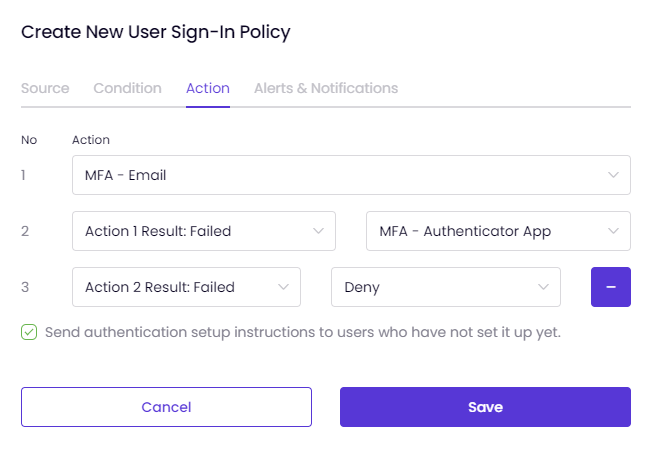 To set Alerts and Notifications for your policy,
To add customized behaviors to your network, visit Timus Manager, then select Zero Trust Security> Behaviors. This allows you to expand on the default behaviors provided by ZTNA for more comprehensive risk assessments in network use cases.
To find your network's pre-configured behaviors, go to the Name and Details parameters page. These behavior settings are already set up for your network and can be viewed and adjusted if necessary.
The general information of the default behaviors displayed on the page are as follows:
To create custom behaviors for your network policies, do the following:
Timus Zero Trust Policies provides a user/ behavior-based access control as an alternative to traditional IP-based access control and makes it easier for an organization to manage network access.
The policies within Timus' Zero Trust Network Access (ZTNA) security framework are organized and prioritized by its place in the policy table. A policy, which is placed higher in the table, is more prioritized than the other policies.
It means that you are able to prioritize the Timus ZTNA rules by yourself.
It allows for more granular control over access rights, ensuring the right people have the right access at the right time.
The security model of this zero trust approach protects your organization against potential threats by increasing network security.
This article shows administrator how to create Timus ZTNA's behavior-based administrator sign-in policies and apply them to your network.
Timus ZTNA's policies provide a distinctive and enhanced access control approach to expand your business while maintaining the fundamental aspects of your network security: Infrastructure, Application and Data, User and Device.
To protect your organization and users against today's ever more sophisticated cyber security threats, you can create User/Administrator-based sign-in policies in Timus Manager that automatically respond to any predefined risk level.
On the Admin Sign-in Policies page, you can view the following left to right:
The policies within Timus' Zero Trust Network Access (ZTNA) security framework are organized and prioritized by its place in the policy table. A policy, which is placed higher in the table, is more prioritized than the other Admin Sign-In policies.
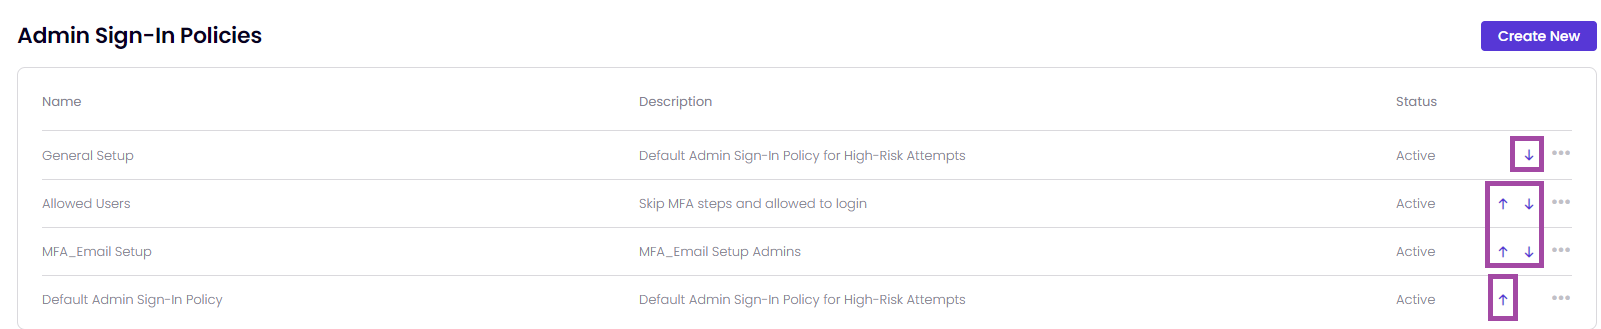
It means that you are able to prioritize the Timus ZTNA rules by yourself.
You cannot Deactivate or Delete the default administrator sign-in policy.
On the Source tab,
On the Condition tab,
When "All Selected Behaviors" is chosen, all selected behaviors such as Untrusted IPs, New Device, and Breached E-mail Address must be active simultaneously for the policy to take the action.
When "Any Selected Behavior" is chosen, at least one of the selected behaviors must be triggered the policy to take the action.
You can consider All Selected Behaviors like "AND &&" and Any Selected Behaviors like "OR ||" as in coding language.
Experience the user-friendly interface of Timus by hovering over the info icons on the policy creation screen:
When you add a behavior to the policy with the add behavior button on the screen and hover over that behavior, you can view the brief explanation about the behavior you added:
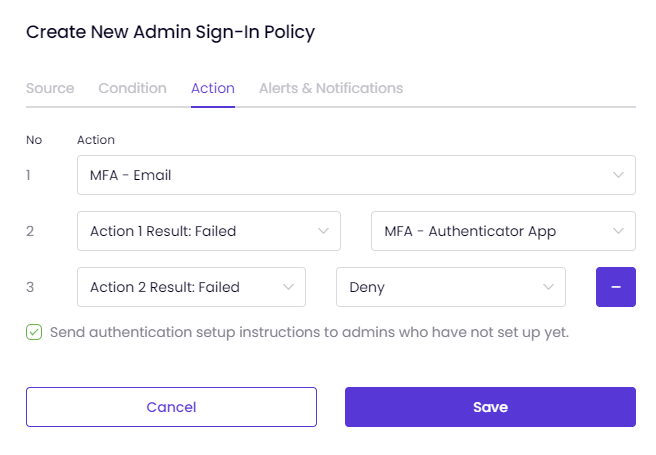
In the Action tab,
Decide what action the system should take when a behavior triggers the policy. The actions defined in the system are as follows:
You can set multiple actions for multifactor authentication with Timus ZTNA.
The actions you select are numbered in the tab shown on the left.
So, in a scenario where the first authentication step fails, you can enable another action for login attempts and send authentication setup instructions to administrators who have not completed the setup process.
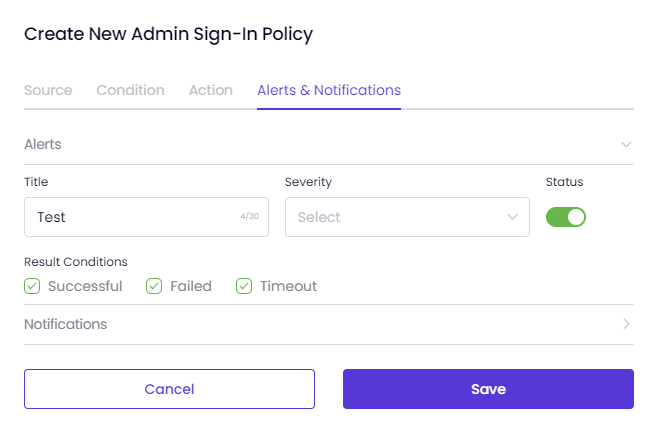
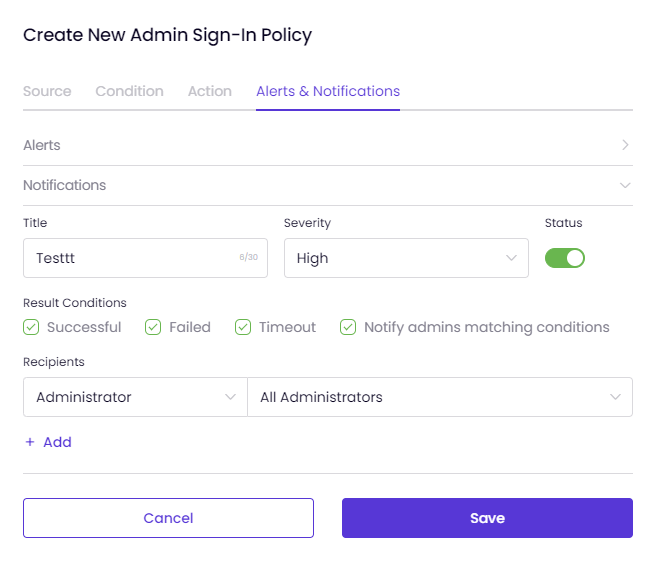
On the Alerts and Notifications tab, you can configure the policy to send Alerts and Notifications each time it is triggered.
Key Benefits:
Scenario: An IT security team wants to block a suspicious process named "dllhost.exe" running on a user's device, which could compromise the integrity and security of the network.
Implementation:
Result:
Scenario: An organization needs to ensure all devices running Windows have an OS version that meets their security requirements.
Implementation:
Result:
Use Case 3: Monitoring and Restricting Insecure Running Processes
Scenario: An IT security team wants to ensure that certain potentially insecure processes are not running on any device within the network.
Implementation:
Result:
Scenario: A critical service must be running on all devices for compliance and operational reasons.
Implementation:
Result:
Implementation:
Result:
For Windows Devices:
For macOS Devices:
Displays network interface details such as Interface, FriendlyName, Address, Mask, Type, and MAC. Clicking on "Details" provides more in-depth network information.
For Windows Devices:
For macOS Devices:
Displays installed programs on the device with the following columns: Program Name, Version, Install Location, Publisher, Install Date, and Last Runtime.
For Windows Devices:
For macOS Devices:
Displays running processes on the device with the following columns for both Windows and macOS:
Clicking on the three dots next to a process entry provides options to view more detailed information about the process.
Viewing Process and Listening Port Details
In the Services tab, you can see the services running on the device. The information displayed varies slightly between Windows and macOS devices:
For Windows Devices:
For macOS Devices:
For Windows devices, the Startup Items tab displays a table with information about programs that are configured to run when the system starts. The table includes the following columns:
In the Routes tab, routing information for both Windows and macOS devices is displayed. The table includes the following columns:
The reports in Manager → Insights → Device Posture Reports will display device posture checks created for attributes from Timus Connect. This allows administrators to monitor compliance and security status effectively, ensuring that all devices meet the required posture standards based on the detailed and specific checks configured.


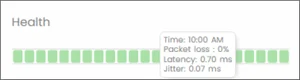
This Connectivity section helps you make informed decisions or take necessary actions to optimize network connectivity.


The Network Statistics for the Primary WAN of the site you are currently viewing in your Timus Manager are as follows:


Latency:
Jitter:
Loss (Packet Loss):
Upload:
Download:
(Connection) Health:
To access the Health scale that ranks connection quality from best to worst, follow these steps:
The IPsec protocol suite can set up direct and encrypted connections between supported devices by offering a framework for securing data traffic between two servers.
Creating an IPsec tunnel via Timus, you can transfer the data securely between the peers of the connection.To create a site-to-site IPsec VPN gateway connection between your on-premises network and a virtual network (VNet) please follow these steps:Here are the two phases of internet key exchange (IKE) required to set up an IPsec connection using Timus.


As shown in the sample image below of the parameters tab, there are default settings that need to be configured for the IPsec tunnel connection you are about to create in order for it to function correctly:


To find your Local Primary WAN IP address,


This article will help you establish a site-to-site IPsec connection between Timus Networks and PfSense.
IPsec tunnel between Timus - PfSense: PfSense Configuration for Timus:
Go to PfSense UI -> VPN -> IPsec.
General Information:
 IKE Endpoint Configuration:
 Phase 1 Proposal (Authentication):
 Phase 1 Proposal (Encryption Algorithm):
 Expiration and Replacement:
 Advanced Options:
 Once you have completed the steps as shown in the images above, hit Save to complete the Phase 1 configuration on PfSense.
 In this example, we consider that the local subnet belonging to PfSense is 10.10.10.0/24 and Remove Subnet is 192.168.249.0/24 (WireGuard subnet on Timus).
 Once you Add P2 or Edit the P2, you will be able to see the Phase 2 configuration of PfSense.
 Networks:
 Phase 2 Proposal (SA/Key Exchange):
 Expiration and Replacement:
 Keep Alive:
 You can hit Save to complete the Phase 2 configuration of PfSense.
 After completing the steps above, please add a Firewall IPsec rule on PfSense as shown in the image below to let the Phase 2 work on both Timus and PfSense.


Parameters:

Miscellaneous:


Phase 2 configuration of Timus:

Services
Service Category
HTTP
Web Access
HTTPS
VoIp
SIP
Database Access
MSSQL_SERVER
MSSQL_MONITOR
MYSQL
POSTGRESQL
Remote Access
RDP
SSH
TELNET
VNC-RFB
RPC
DCE-RPC
File Access
FTP_DATA
FTP_CONTROL
TFTP
SMB
Network Services
DNS
DNS_MULTICAST
DNS_OVER_TLS
DNS_OVER_QUIC
DHCP_SERVER
DHCP_CLIENT
NTP
SNMP
SYSLOG
SSDP_UDP
SSDP_TCP
IMAP
IMAPS
POP3
POP3S
SMTP
SMTPS
Authentication
LDAP
LDAPS
RADIUS
KERBEROS_AUTH
KERBEROS_PWD
KERBEROS_ADMIN
Protocol
HOPOPT
ICMP
IGMP
GGP
IPv4
ST
TCP
CBT
EGP
IGP
BBN-RCC-MON
NVP-II
PUP
ARGUS
EMCON
XNET
CHAOS
UDP
MUX
DCN-MEAS
HMP
PRM
XNS-IDP
TRUNK-1
TRUNK-2
LEAF-1
LEAF-2
RDP
IRTP
ISO-TP4
NETBLT
MFE-NSP
MERIT-INP
DCCP
3PC
IDPR
XTP
DDP
IDPR-CMTP
TP++
IL
IPV6
SDRP
IPV6-ROUTE
IPV6_FRAG
IDRP
RSVP
GRE
DSR
BNA
ESP
AH
I-NLSP
SWIPE
NARP
MIN-IPV4
TLSP
SKIP
IPV6-ICMP
IPV6_NONXT
IPV6_OPTS
CFTP
SAT-EXPAK
KRYPTOLAN
RVD
IPPC
SAT-MON
VISA
IPCV
CPNX
CPHB
WSN
PVP
BR-SAT-MON
SUN-ND
WB-MON
WB-EXPAK
ISO-IP
VMTP
SECURE-VMTP
VINES
IPTM
NSFNET-IGP
DGP
TCF
EIGRP
OSPFIGP
SPRITE-RPC
LARP
MTP
AX.25
IPIP
MICP
SCC-SP
ETHERIP
ENCAP
GMTP
IFMP
PNNI
PIM
ARIS
SCPS
QNX
A/N
IPCOMP
SNP
COMPAQ-PEER
IPX-IN-IP
VRRP
PGM
L2TP
DDX
IATP
STP
SRP
UTI
SMP
SM
PTP
ISIS_OVER_IPV4
FIRE
CRTP
CRUDP
SSCOPMCE
IPLT
SPS
PIPE
SCTP
FC
RSVP-E2E-IGNORE
MOBILITY_HEADER
UDPLITE
MPLS-IN-IP
MANET
HIP
SHIM6
WESP
ROHC
ETHERNET
AGGFRAG
NSH
If you enable Custom Source Port, you are allowed to define a specific source port. Otherwise, the source port would be selected as Any.


The "Adult" category comprises web pages containing images or videos depicting sexual acts, sexual arousal, or explicit nude imagery with a sexual intent. It also includes pages that use frequent or serious profanity. Additionally, this category encompasses pages whose primary content is child-appropriate, but with regular or irregular sections featuring sexually themed, non-educational material. Web pages with sexual content, products, or services related to sex, but without explicit nudity, are part of this category. It also includes pages featuring tasteless content, such as cruelty to animals, bathroom humor, and other potentially inappropriate material for children.
The "Alcohol" category includes web pages that promote, advocate, or sell alcohol, encompassing a variety of beverages such as beer, wine, and hard liquor. These pages may feature information about different types of alcoholic products, brands, and related events. They could also provide details on the production, distribution, and consumption of alcoholic beverages. Additionally, these web pages might offer the option to purchase alcohol online or provide resources for locating physical stores selling such products. The content within this category is focused on the promotion and commercial aspects of the alcohol industry.
The "Anonymizers" category includes web pages that promote the use of proxies and anonymizers. These tools are intended to facilitate anonymous and unrestricted access to websites by bypassing filters and other online restrictions. Anonymizers are often employed to conceal the user's identity and location, allowing them to browse the internet without revealing personal information. These pages may provide information, tools, or services related to the use of proxies for the purpose of maintaining online privacy and evading content restrictions.
The "Banking" category encompasses web pages operated by or dedicated to banks and credit unions, with a specific focus on online banking applications. This category excludes online brokerages, concentrating on financial institutions providing services related to traditional and digital banking, including account management, transactions, and financial services.
The "Business & Services" category encompasses a wide array of web pages, covering real estate transactions, agriculture-related information, construction and architectural services, genetics research, and biotechnology firms. It serves as a general category for businesses not fitting into more specific classifications, including furniture makers and retail outlets. The insurance sector is also represented, spanning various types from health to car insurance. The category further includes manufacturing and industrial production businesses, as well as those involved in security products and services, excluding computer security. Information on retirement homes and communities, inventory management, and connections within communities are also part of this diverse category, along with advertising agencies and marketing services, excluding online banner ads. In essence, "Business & Services" provides a comprehensive overview of commercial and service-related content.
The "Chat" category encompasses web pages designed for real-time communication, featuring chat rooms and messaging functionalities that facilitate group discussions among strangers or friends in both public and private settings. These pages serve as platforms for interactive conversations, allowing users to engage in discussions with others. Additionally, the category includes instant messaging software and web pages that enable users to stay connected with a list of "buddies" through messaging services. In essence, "Chat" provides diverse means for individuals to communicate in real-time, fostering both group interactions and one-on-one conversations through messaging platforms.
The "Content Servers" category includes web servers that lack navigable web pages and are primarily employed for hosting images and other media files. These servers play a crucial role in enhancing web page performance and site scalability by offloading media content delivery. Instead of serving complete web pages, they focus on efficiently delivering media elements, reducing page load times and optimizing the overall user experience. Content servers are integral to content delivery networks (CDNs) and are strategically positioned to distribute multimedia content, ensuring faster and more reliable access to images and other media resources for website visitors.
The "Criminal Activities" category includes web pages that promote extreme ideologies, discrimination, and hate based on factors like political affiliation, gender, race, or religion. Additionally, it encompasses pages that promote illegal drugs, including information on common illegal drugs and the misuse of prescription drugs. Content depicting physical or sexual abuse of children is also covered in this category. Moreover, the category includes web pages providing information on illegal activities such as burglary, murder, bomb-making, and lock picking. Pages with tools and information facilitating online crime, unauthorized access to computers, and fraud are part of this category. Furthermore, it involves content related to marijuana, covering aspects like legalization, medicinal use, and general information. Lastly, the category includes pages that provide access to illegally obtained files, such as pirated software, movies, and music, as well as sites offering assistance in cheating on homework and tests.
The "Culture & Arts" category encompasses web pages related to the development or display of the visual arts. This includes platforms featuring various forms of artistic expression, such as paintings, sculptures, and other visual creations. Additionally, the category includes web pages dedicated to published writings, spanning fiction and non-fiction novels, poems, and biographies. These pages serve as platforms for authors and literary enthusiasts to share and explore written works across different genres and styles.
The "Dating" category encompasses web pages that are focused on promoting relationships, including dating and marriage. These websites are designed to facilitate connections between individuals seeking romantic partnerships. They may feature profiles, matchmaking services, and communication tools to help users interact and potentially form long-term relationships. The content typically revolves around dating advice, relationship tips, and platforms for meeting and connecting with potential partners.
The "Education" category comprises a variety of web pages tailored to facilitate learning and academic pursuits. It includes pages for schools with an online presence, encompassing universities, private and public schools, and other real-world educational institutions that offer online resources and information. Additionally, the category covers web pages hosting academic publications, journals, research findings, curriculum details, online learning courses, and materials, providing a comprehensive repository for scholarly content and educational tools. These pages cater to students, researchers, and educators seeking valuable resources for academic enrichment. Furthermore, "Education" includes web pages containing reference materials, offering data compilations and reference shelf content such as atlases, dictionaries, encyclopedias, census data, and other reference materials. These resources contribute to a well-rounded educational experience, supporting users in their quest for knowledge and information.
The "Entertainment" category encompasses a diverse range of web pages designed to provide amusement and enjoyment. This includes pages featuring comics, jokes, and other humorous content to elicit laughter and entertainment. Furthermore, it includes platforms offering internet radio, streaming media, and downloads related to musicians, bands, MP3s, and various media content. Additionally, the category covers web pages dedicated to animated TV shows, movies, comic books, and graphic novels, catering to fans of animated and illustrated entertainment. News and gossip about celebrities, television shows, movies, and the broader entertainment industry are also featured, keeping users informed about the latest developments. Moreover, "Entertainment" includes pages devoted to the venues of entertainment, such as comedy clubs, nightclubs, discos, festivals, theaters, and playhouses, offering information about places where entertainment events unfold. Lastly, the category encompasses web pages providing comprehensive content about television shows and movies, including reviews, showtimes, plot summaries, discussions, teasers, and marketing materials, creating an immersive experience for enthusiasts.
The "Environment" category encompasses web pages dedicated to fostering awareness and understanding of environmental issues. These pages provide information on various aspects of sustainability, including sustainable living practices and initiatives. Additionally, the category covers content related to ecology, delving into the study of ecosystems, biodiversity, and the interactions between organisms and their environments. Furthermore, these web pages offer insights into nature and the environment, sharing knowledge on topics like wildlife conservation, natural habitats, and environmental conservation efforts. By compiling information on environmental


The Map to Port feature allows you to specify a range of ports on both protocols, TCP or UDP, for instance, 70-75, and map them to a destination range, such as 80-85. Ports are forwarded sequentially: port 70 maps to port 80, port 71 maps to port 81, and so on. This feature is useful for port forwarding in a one-to-one manner."

In the Traffic Logs page, where you can access comprehensive data presented through tables and graphics organized into various tabs. Here's an overview of what you'll find in each tab:

You can download the csv file to get a report for your traffic by clicking on Export at the top right of the screen as shown in the image above.
Only the last 10.000 records will be exported when you have created it.

When you have clicked on the Export button, you will see the pop-up above when the Export process is completed successfully. You can click on Download to get your report.
This organized approach allows you to analyze user behavior, team activities, device usage, application preferences, website interactions, and network engagement.
Dive into detailed insights to make informed decisions about your product usage and optimize your resources effectively.

Click on the "Search" button.
By clicking the Search button, you can access a list displaying all the traffic generated by this user on your network.
To access the details of the traffic logs listed, click on the blue info icon located at the far right of the respective line.

You can use the Search bar to display more specific information about the logs you want to see.
Simply insert the desired columns with the appropriate command:
Time: Select the Start and End date of the traffic logs you want to display on the list.
Action: Choose between Drop or Allow.
Destination: Specify Team, Device, IP, Network, Site, or Any.
Factor: Specify Application, Category, Website, Keywords, or Any.

After selecting the user, you display the following information on the page.


You can also view traffic details for the following components by going to the Insights dropdown > Traffic Logs page:
To turn on these notifications, go to the Alerts & Notifications tab on the Zero Trust Sign-In Policies pages. (User/Admin)
To filter your alerts, use the Search filter located at the top of the Alerts page:


You can see the details of the each by clicking on the ellipsis icon at the end of the row:

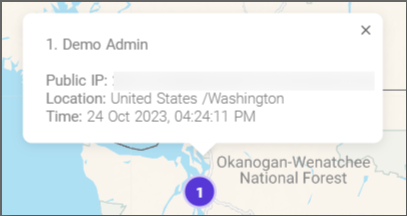
The IP Intelligence section is only visible when a sign-in policy with the Untrusted IP Behavior has been defined for the specific IP.

Before creating a report, it is important to first manage the templates. This will allow you to choose analytics and insights you want to include in your report, using either predefined or custom templates.

To view the template or create a report using Timus's default Predefined Weekly Template, click the ellipsis icon next to it.
You also have the option to use the template as a basis for a new one:

To create a custom template,


Once your report is created, you can view the results by clicking on the Actions button and selecting the Go to Results page option on the report's page.
The generated reports will be saved on the report's page. You can access and view all reports generated on different dates by using the Displayed Report filter.
To configure the widgets, click on the "Show Template" option located on the report page. This is the same process as when you access it from the "Manage Templates" -> "Edit" page.


What no gateways available mean and possible scenarios
This information message means that if the user is not allowed to connect to any gateway, a specific message will appear in the Timus Connect application.
The administrator must select the remote site for the user in the manager.
But there can be another root cause to show this error when;
To verify that, please run:
ping user.timuscloud.com
ping device.timuscloud.com
Also, try to go to user.timuscloud.com or device.timuscloud.com from the browser. If user can not reach connect application will not able to connect.
timus-connect-background service is not running
Go to Activity Monitor (Mac) or Task Manager (Windows) on your device and find timus-connect-service.
Alternatively, you can go to http://localhost:49202 in your browser. If you see the output, it means the service is running.
If you validate that the service is not running, please follow these steps:
[MacOS] Validate if service is running
Run the commands below to check if they exist:
#for connect service
cat /Library/LaunchDaemons/timus-connect-service.plist

#for helper service
cat /Library/LaunchDaemons/timus-helper-service.plist
After running the commands, if they exist, please run this command to load the service. After running, please check if the service has started.
# Avoid if error occurs after running these commands. This is just a make sure none of instance exist on device
sudo launchctl unload /Library/LaunchDaemons/timus*
sudo launchctl load /Library/LaunchDaemons/timus*
[Windows] Validate if service is running
Find services from search
Make sure this 2 services are exist
If they are not exist and running state try to install them manually see if any error occurs. For clean service install run these commands
sc.exe stop timus-helper-service
sc.exe stop timus-connect-service

taskkill /F /IM "timus-connect-service.exe"
taskkill /F /IM "timus-helper-service.exe"

sc.exe delete timus-connect-service
sc.exe delete timus-helper-service

cd C:\\Program Files\\Timus Connect\\resources\\service

timus-connect-service.exe -service install && timus-connect-service -service start
timus-helper-service.exe -service install && timus-helper-service -service start
After validation, if you see that the services are still not running and nothing works, try to start the service manually and check if any crashes occur.
[MacOS] Validate if service crash
Run this command and see if service works
#for connect service
sudo /Applications/Timus\\ Connect.app/Contents/Resources/service/timus-connect-service

#for helper service
sudo /Applications/Timus\\ Connect.app/Contents/Resources/service/timus-helper-service
[Windows] Validate if service crash
Run these commands
cd C:\\Program Files\\Timus Connect\\resources\\service
timus-connect-service.exe
Let’s assume that a crash happened, which in most cases (99%) is a permission issue.
At this point, it is better to perform a clean setup by removing all files we have and reinstalling Timus Connect. Please find the section with the clean setup steps for Timus Connect.
Sometimes, SentinelOne, Bitdefender, or other security tools can prevent Timus Connect from working. We can confirm this by checking the task manager or asking the customer.
Explore our most popular video tutorials on our YouTube channel.
Manage your network, add tunnels, users, rules and licenses from a multi-tenant cloud portal with Timus.
Connect to offices or protect SaaS apps through private gateways with a single static IP address.
The Timus firewall sits in the cloud and intercepts all encrypted user traffic.
Timus uses zero-trust secure remote access and least privilege principles before granting any access to the network and data to protect against hackers, criminals, and ransomware. Additionally, Timus uses a best-of-breed DNS filter (at the network level) protecting users from zero-day threats and malicious sites from wherever they may encounter it (any device, application, protocol or port). A user is protected against all of the below: Malicious software including drop servers and compromised websites, including drive by downloads and adware Fraudulent phishing websites that aim to trick users into handing over personal or financial information Command and Control botnet hosts Sites which serve files or host applications that force the web browser to mine cryptocurrency Domains which have been registered in the last 30 days and in the last 24 hours Parked sites & domains that may no longer be controlled by the original owner
The Timus solution is superior to traditional VPNs for secure remote access. User verification is hardened with behavioral and contextual analysis. Multi-factor authentication (MFA) can be deployed adaptively (ie. when signing in from a new device, new country, etc), improving user experience. Timus ZTNA can work with another IAM solution or standalone. Timus has one of the richest behavioral checks in the industry for Zero Trust Verification.
Timus provides dedicated gateways with static IP addresses. An MSP can whitelist the Static IP in SaaS applications for controlled access and security.
WireGuard and OpenVPN tunneling protocols are supported.
The tunnel for secure connections can be configured to pass all user traffic, or just part of it, through the tunnel. Split tunnel configurations can be created in Manager->Settings-Tunnel Configuration page. Default configuration is all traffic passes through the tunnel. Timus Connect agent gets the tunnel configuration valid for the user and context, and passes traffic through the tunnel accordingly. This feature is currently available only for Windows and macOS releases of Timus Connect app.
Still have questions? Explore our in-depth documentation for comprehensive guides and detailed solutions.
Go to documentation